Bilingualism’s Cry for Attention: how bilingualism can help curb the current wave of nationalism
Mariana Suárez-Rebling
Professor Mira Debs
EDST 245: Public Schools and Public Policy
05/03/17
Bilingualism’s Cry for Attention
how bilingualism can help curb the current wave of nationalism
Introduction
Am I French? Am I American? Am I Mexican? These are questions that I have been asked by others and asked myself countless times. My parents are Mexican, my sister and I are first generation American and we both attended the Lycée Français de New York. My school was taught entirely in French – other than our daily English class- and allowed students to obtain both American and French High School diplomas. Our school consisted of 1,300 students from pre-k to 12th grade; 30% were French citizens, 30% were French dual citizens, 30% were at least half American and only around 10% had both parents who were from neither the U.S nor France. I was a part of that minority. Everyone wondered why two Mexican parents had decided to send their daughters to a French school, while having no French background or remote knowledge of the language. Why had my parents not simply sent me to an American school?
My parents chose to send me to a school in which only a handful of my classmates knew what the word “integer” meant before SAT prep started Sophomore year. We had done of advanced math but it had all been held in French. None of my French standardized test scores mattered to American colleges, and most of my friends went back to Europe after graduation. I was obligated to take the TOEFL exam. Yet, my parents found these issues trivial compared to the benefits of my bilingual education experience. They valued diversity more than most of our skeptical American family friends did, and rightly so. People seemed to make different assumptions about my nationality based on the environment we were in: I was French-Mexican when with my American friends, Mexican-American in school, Mexican to the Americans and American to the Mexicans. Despite the confusion, I could communicate both verbally and culturally with a much wider variety of people than most of my friends could from a very young age. I learned to embrace diversity in a way that opened my eyes to a very different perspective on the world. But why does this matter today? Many of the anti-globalist problems present in our world today stem from nationalistic and racist views on immigration, inclusion and violence. This wave of nationalism has led to a resurgence of ignorance to the benefits of multiculturalism. Though these problems are in no way easily nor rapidly solvable, a productive step in the right direction is bilingual education.
The History of Bilingualism
In the late seventeenth century in the United States, bilingual education was common practice. When the first colonists were arriving to the United States, most were still teaching their children in their native language, especially Germans. A shift then occurred in the late 1800s: the rise in nativism and large wave of new immigrants at the turn of the century. This shift mixed with the start of World War I led to bilingual education being replaced by efforts to make schools feel more anti-foreign. (8)
In the late twentieth century, many parents, particularly immigrants, were opposed to sending their children to bilingual schools. This stemmed from a stigma against non-assimilated individuals in society. According to a book written in the 1970s by Barry McLaughlin, Second-language acquisition in childhood, “various ethnic groups strive to maintain their identity by raising their children bilingual.” (18) In this case, however, bilingualism means that the child only speaks the non-English language at home, never outside. The book explains that this is due to bilingualism being “a social problem because language is so intimately a part of one’s identity. The distrust shown by many people and governments toward bilingual individuals stems largely from the feeling that they are not loyal citizens because they can speak another language.” (p.2). This belief was developed after a long period of war, which involved the US developing its military more than ever, and segregation. This state of war, increased nationalism and decreased multicultural education. (18)
The combination of these things lead to a nation-wide distrust towards those who weren’t patriotic in every respect including language. As Barry McLaughlin’s book states, “This hostility toward bilingualism has nothing to do with language as such. The hostility is directed not at language but at culture. The bilingual represents an alien way of thinking and alien values” (p.3). This provides insight into the mentality of people in the 70s, whose insights were influenced by nationalism and lack of exposure, leading to racist thoughts. McLaughlin, though unintentionally, also seems to further the idea that being introduced to a different language- and by extension its culture- at a young age produces more open-minded individuals who don’t view the “bilingual” as having an “alien way of thinking” but rather as a person having a different opinion or view. (18)
Benefits of bilingual/bicultural education:
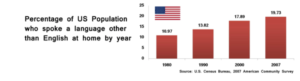
Our world has become significantly smaller thanks to social media. Bilingualism has become increasingly possible with this potential for instant communication. The graph below, taken from “The DANA Foundation” website under the “Cognitive Benefits of Being Bilingual” article published in 2012, shows us that from 1980-2007, there was a substantial increase in the percentage of people in the US who spoke a language that wasn’t English at home. (9)
Today, a larger portion of the world’s population is bilingual or multilingual than monolingual. Research has proven that there are certain benefits that have come up time and time again for kids who learn a second language. Harvard’s associate professor at the Graduate School of Education said that “Bilingualism is an experience that shapes our brain for a lifetime”. The main advantages identified so far include attention, school performance and health benefits. (1)
Attention
People who speak two languages often outperform monolinguals on general measures of academic performance. “[Bilinguals] can pay focused attention without being distracted and also improve in the ability to switch from one task to another,” says Professor Antonella Sorace – a linguistics and english language expert. (9) According to the DANA Foundation, this is due to the cognitive developments that occur, which allow for individuals to “inhibit one language while using another.” (6)
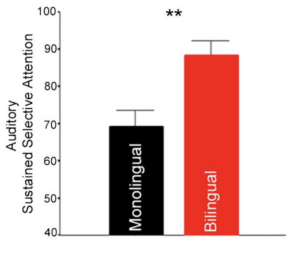
The graph represents the difference between a monolingual and bilingual individual to have sustained attention.
School Performance:
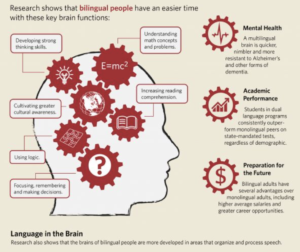
This graph provides visual evidence in favor of the idea that the brain developments that take place due to bilingualism have strong benefits towards one’s academic performance. This is due to the “thinking skills”, mathematical understandings , logic and focus as is demonstrated in the graph. Furthermore, bilingual children, when switching between languages, must follow social cues in order to know which language to speak to whom. This need for accentuated social understanding leads to hyper-developed fundamental social and emotional skills with kids starting at around 3 years old. On top of these social abilities, kids who speak more than one language have been proven to be better English readers than native English speakers due to their puzzle-solving talent. (4) (11)
Health Benefits:
The health benefits of an individual who is bilingual are the most tangible of the advantages. Due to developments in the brain that take place during the learning of a second language, one’s memory is deeply strengthened. This increase in memory, has been proven to delay dementia in patients who have a predisposition to the illness. Doctor’s have found that, though the average age of dementia patients during their first doctor’s appointment is 71.4 years old, that of bilingual patients is 75.8. This might not stop the dementia from occurring but it allows for an incredible delay that provides a longer period of health and normality in a patient’s life. (4), (6), (7)
Policies:
There have been several policies in the past that have tried to establish some momentum in furthering bilingual education. Today, it seems that despite the time that has passed, we may be moving in circles.(12) In 1923, thirty-four states passed laws mandating English as the language of instruction in public schools. This ended any possibility of establishing a curriculum in which English Language Learners (ELL) would be able to learn the core courses in their native languages ( mostly catered towards Spanish speakers), while taking English classes. (14)
In 1963, due to the large number of Cuban immigrants to Miami, elementary schools began offering bilingual education programs for Spanish-speaking students. In the 1970s, states were funding bilingual education programs. Many passed laws allowing schools to teach in languages other than English. (13) (15)
In 1974 the case Lau v. Nichols, a class-action suit brought on behalf of Chinese students from San Francisco, went to the Supreme Court. (16) Most students were not receiving the special instruction that they required due to their inability to speak English. The Court decided that these students “were not receiving equal educational opportunity because they did not understand the language of instruction and the schools were not doing anything to assist them.” (17)
There has never been a mandate requiring bilingual education. The courts and federal legislation–including Title VI of the Civil Rights Act of 1964, which “prohibits discrimination on the basis of race, color, or national origin in federally assisted programs and activities”, and the Equal Educational Opportunities Act of 1974, which “defines a denial of educational opportunity as the failure of an educational agency to take appropriate action to overcome language barriers that impede equal participation” are contributors to the progress that has been made in favor of students who are not fluent in English. (4)
Conclusion:
Today, though president Trump hasn’t established specific policies referring to bilingual education, he has spoken extensively about his feelings toward immigrants and his plan to “make America great again”. As his slogan has been analysed time and time again as meaning “make America white again”, there have been predictions that he will not further the pre-existing programs. There have also been concerns about him entirely stopping the ones that already exist. (6)
After researching all of the beneficial aspects of bilingualism, it has become increasingly clear that speaking multiple languages can have positive consequences for everyone, not simply those who speak the languages. Certain benefits identified include strengthened memory, delayed dementia, increased attention span, and academic excellence. However, these are no more important than the more social-based gains, which include cultural understanding, inclusivity and the ability to communicate with a larger group universally.
Due to these social benefits that could occur, the Supreme Court should continue to uphold the rights of non-native English speakers. This should happen for various reasons. FIrst, for the sake of humanity; it must be reminded that regardless of their fluency in English, immigrants are still people and contribute extremely positively to the community. Second, the United States is a country built on immigrants from all continents and backgrounds who unified in order to create a country built on liberty and equality. Third, the United States should make it easier for the motivated, innovative people who chose to move to this country in order to make change. For these creations to take place on US soil is good for the country.
Furthermore, congress should pass a policy to quell these nationalist sentiment by encouraging bilingual education. Education is supposed to enrich an individual both intellectually and socially. Becoming a more well-rounded individual and being more culturally aware are things that will benefit a student far beyond his/her school days. These are things that can create an even smaller world and can allow the violence to lessen. Having gone to a foreign, bilingual school has presented me with the largest diversity of friends, languages and cultures than I could’ve ever imagined. This has created an inclusive nature within me that was developed from the time I was 3 and has kept developing every day since. More kids could develop the same strength.
References:
- Web. <http://www.npr.org/sections/ed/2016/11/29/497943749/6-potential-brain-benefits-of-bilingual-educatio>.
- Web. <http://www.nabe.org>.
- Web. <http://www.npr.org/sections/ed/2016/10/26/498291619/the-return-of-bilingual-education-in-california>.
- Web. <http://www.aft.org/ae/fall2015/goldenberg_wagner>.
- Web. <https://www.theatlantic.com/magazine/archive/1998/05/the-case-against-bilingual-education/305426/>.
- Web. <https://www.ed.gov/news/speeches/importance-bilingual-education>.
, Huffington Post ed.Print.
(9) Web. <http://dana.org/Cerebrum/2012/The_Cognitive_Benefits_of_Being_Bilingual/>.
(10) Academic Press New York San Francisco London. “the Bilingual Child: Research and Analysis of Existing Educational Themes.” (1976)Print.
(11) Afendras. Le Bilinguisme Chez l’enfant.Print.
(12) Carey, S. T. Bilingualism, Biculturalism & Education.Print.
(13) Cohen, Andrew D. A Sociolinguistic Approach to Bilingual Education: Experiments in the American Southwest.Print.
(14) Department of Government Funded Programs and Board of Education of the City of Chicago. “Bilingual- Bicultural Education.” Print.
(15) Educational Testing Service. “Bilingual Education.” Print.
(16) Georgetown University Press, Washington DC. “Current Issues in Bilingual Education.” Print.
(17) Lewis. Bilingualism and Bilingual Education.Print.
(18) McLaughlin, Barry. “Second-LAnguage Acquisition in Childhood.” Print.
(19) Mokhtar Farhadian, Rohani Abdullah, Mariani Mansor, Ma’arof Redzuan, Neda Gazanizadand and Vijay Kumar. Theory of Mind in Bilingual and Monolingual Preschool Children.Print.
(20) Padilla, Raymond V. “Ethnoperspectives in Bilingual Education Research: Theory in Bilingual Education.” Print.
(21) Washburn, David E. “Ethnic Studies Bilingual/bicultural Education and Multicultural Teacher Education in the United States.” Print.
Sex Ed in the Era of Trump: City-Led Reform and Standardization on a Scale that Works
Sex Ed in the Era of Trump: City-Led Reform and Standardization on a Scale that Works
Caroline Francisco / Public Schools & Public Policy / May 2017
Executive Summary
This paper is not intended solely to make the case for comprehensive sexual health education in the United States, nor is it intended as a complete and holistic curriculum proposal; a vast body of research and literature have already established both. Instead, what I hope to explore here is, who should lead the way? Why have some attempts to standardize sex ed been non-effective, and where are more effective policies in place? What political actions can be taken to bring better sex education to American students, and from where should those actions stem? Ultimately, my research suggests two findings. First: that American cities, as mid-levels between school-by-school/teacher-by-teacher action and federal government action, have the most potential to enact effective standardized sex education curricula in schools. I highlight the 2013 implemented in Chicago Public Schools and analyze its effects. Second: that despite a public school system labeled “antiquated,” “failing,” and under fire from the federal government, sex education is a particular area where public schools have potential to excel. (American Federation for Children 2015) (PhilanthropyRoundtable 2013)
Introduction: What is at Stake
Arguing for radical reform of sex education often requires fighting for its existence in the first place. Due to the topic’s charged moralized nature, sex ed has a long history of criticism, especially from religious advocates and those who believe sexual and reproductive conversations belong exclusively in the privacy of the home. Yet in practice, only 43% of parents say they feel “very comfortable” talking to their children about sex, and 50% of teens say they feel uncomfortable talking about sex with their parents. (Planned Parenthood 2011) (Planned Parenthood 2012) Following an incident in Chicago Public Schools (discussed later in this paper’s “Evidence” section), parent Rachel Gigliotti described topics of “sex with a condom, sex without a condom, sex with lube” as “things I wouldn’t even discuss in my own personal life.” (NBC Chicago 2014) If parents are unwilling to discuss fundamental topics like contraception and lubrication in their personal lives, much less with their children, the question is begged: then where, if at all, will young adults learn?
This paper treats education as a public good, and comprehensive sexual education (CSE) as a vital component of that public good. Even differing philosophies of the ‘purpose of education’ offer ample justification for curriculum that includes not only ‘core’ subjects like math and history, but also topics of personal biology, health, safety, risk, and social skills. David Labaree (1997) groups “the root of educational conflicts” into three alternative goals for American education…: democratic equality (schools should focus on preparing citizens), social efficiency (they should focus on training workers), and social mobility (they should prepare individuals to compete for social positions.)” Even though the last goal treats education as a private good, CSE arguably serves all three goals, as its overarching aim is not to encourage premature sexual activities but to empower young people to know the facts, know their rights, and make informed decisions.
Consider the topic of informed consent—when a young person is taught that they equally have the right to say “yes” and the right to say “no,” and a universal right to have their answer honored, they are not only more equipped in sexual situations, but in everyday interactions, in the workplace, legally, and in any situation involving power dynamics. The ripple-effect social implications of this are huge; consider that in 2016, 46% of Americans voted for a candidate well-known for saying, about “beautiful women,” “Grab ’em by the pussy. You can do anything.” (Leip 2016) (NY Times 2016) Would this be the case if every American were educated about consent from a young age? Furthermore, plenty of evidence suggests that good sex education keeps more kids in school longer, to complete the rest of their education: “Nearly one-third of teen girls who have dropped out of high school cite early pregnancy or parenthood as a key reason. Only 40 percent of teen moms finish high school, and less than two percent of teen mothers (those who have a baby before age 18) finish college by age 30.” (Shuger 2012)
The term “comprehensive” sex ed has emerged to distinguish itself from “abstinence-only” sex ed which advises—in many cases morally requires—abstaining from sexual activity until marriage. (By extension, this implies that humans relinquish their right to sexuality if they do not conform to social constructs of marriage.) Abstinence-only education is historically ridden with value judgments against sexually active individuals and double standards against women. In various abstinence-only curricula around the country, a woman who has lost her virginity before marriage is likened to a dirty sneaker, a chewed stick of gum, a used piece of tape, or a piece of chocolate that has been passed around the class: used, dirty, undesirable, and worthless. (LastWeekTonight 2015) (Semuels 2014) This sends messages to young girls that they exist to marry and be valuable to men, that sexual activity devalues them, that “they cannot be sexual beings in the way that boys can,” and for female victims of sexual assault, that the fault is theirs. (Beyoncé 2014)
Is this kind of education the norm or the outlier? What does sex ed look like in most American public schools? A proper diagnosis is elusive; despite the growing trend towards accountability measures in core subjects, almost no accountability or effective standardization exists for sex ed. Research shows however that even in 2017, sex ed in America looks more like the “chewed stick of gum” model than not. Guttmacher Institute, which provides the leading data on sex ed standards, reports that as of May 1, 2017, only 24 states and Washington DC mandate sex education, and only 13 require that the information presented be “medically accurate.” 37 states require that when sex ed is offered, abstinence be either “stressed” (26) or “covered” (11), while only 18 states require offering information on contraceptives. Only 2 states explicitly prohibit sex ed programs from promoting religion, and in 3 states—Alabama, South Carolina, and Texas—any information presented on non-hetero sexual orientation must be explicitly negative. Furthermore, countless schools rely on outsourced curriculum materials—public or private—to show in their classrooms, which means that variance from school to school is almost impossible to track. Some kids are getting Planned Parenthood representatives in class, some kids are getting condom-on-banana demonstrations in class, some kids are getting the chewed gum analogy, some kids are getting a lady John Oliver describes as “trying to yell the horniness out of teenagers,” some kids are getting exhaustive lists of sexually transmitted diseases without ever being taught what sex is or how it works or why humans have it in the first place. (LastWeekTonight 2015) Some kids are getting nothing at all.
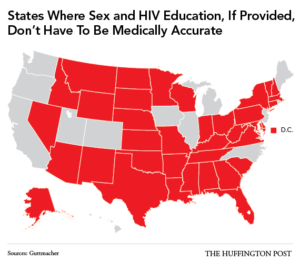
Figure 1. Map from the Huffington Post via Guttmacher Institute. (Klein 2014)
What are we trying to prevent? Are we trying to prevent students having sex? Or are we trying to prevent early pregnancy, sexually transmitted diseases, sexual assault, and unhealthy sexual relationships? Abstinence-only education leans on the former even if under the guise of the latter. And while there is a strong philosophical case to be made that only the latter deserves a place in public education, extensive research shows that abstinence-only education is already failing at both. In 2014, the same Mississippi town that used the dirty chocolate classroom lesson reported that 76% of teenagers are sexually active while in high school, and that the local birthrate was 73 out of 1,000 females between 15 and 19: nearly triple the national rate at the time, which while declining, is still among the highest in the developed world. (Semuels 2014) (Holpuch 2016)
By contrast, a “comprehensive” sex education is set apart not only by medical accuracy but by inclusivity. While abstinence is technically medically accurate (yes, it is the only 100% effective way to prevent pregnancy and STIs), it omits much of the larger picture: the normalcy of sexuality in development, informed consent, contraceptive methods (especially those beyond the male condom), abortion, sexual pleasure, masturbation, forms of attraction, gender identity, sexual orientation, healthy relationships, and more. (Advocacy for Youth)
Ironically, the crux of the dilemma is that while CSE programs are elusive, support for them isn’t. National endorsement of CSE is overwhelming, not only among medical, scientific, and public health professionals, but also among education authorities, and even the American public. (SIECUS) So why is CSE so difficult to implement? The next sections explore attempts to enact and enforce CSE on various scales, and where this has been most effective.
Background: Attempts at Standardization
A 2015 editorial by Alice Dreger—writer, medical historian, bioethicist, and parent of a high-school boy—asked “Why isn’t sex education a part of Common Core?” Her question raises a confusing trend in national accountability: Common Core has embodied the huge push in national curriculum standardization, yet it only accounts for math and language, leaving other subjects relatively untouched. In some cases, Common Core’s emphasis on these two subjects has even had adverse effects on other subjects: in schools where standardized math/ELA test scores are low and budgets are increasingly skimpy, ‘non-core’ programs such as art, music, technology, physical education, vocational education, and health are often first on the chopping block to accommodate more time, money, and resources towards raising scores. In her article, Dreger advocates for consent and pleasure education to replace time spent on “endless lessons about how to put on a condom,” apparently not realizing how many American students won’t get condom education at all, much less consent or pleasure education. Oddly enough, she addresses the disparities in American sex ed twofold, both explicitly in her call for national standards, and implicitly in her ignorance of ‘how bad some other kids have it.’ (Dreger also gained media attention later that year for live-tweeting her son’s East Lansing, MI sex ed class, which featured abstinence-only speakers connected with a local anti-abortion “crisis pregnancy center.” (MLive 2015) The awareness she raised eventually pushed the school board to pull the religiously-affiliated speakers from their curriculum. (Culp-Ressler 2015))
Ultimately, Dreger’s article does more to advocate for why CSE should be nationally standardized than explain why it is not already. To answer this question, it’s necessary to delve into the history of sex ed standardization attempts, and examine the stark contrast between the drivers of Common Core and the drivers of nationalized CSE.
Though not remotely affiliated with Common Core, national sex education standards do exist, and they are comprehensive. “The National Sexuality Education Standards: Core Content and Skills, K-12” were released in 2012 by the Future of Sex Education (FoSE) Initiative, a “partnership between Advocates for Youth, Answer, and the Sexuality Information and Education Council of the U.S. (SIECUS).” They differ from Common Core in several key ways.
- Curriculum and tools for teachers are free, online, and open-sourced. FoSE’s website provides not only a detailed list of the standards for each grade, but a long list of tools for implementation that hone in on training teachers and other personnel (nurses, psychologists, etc.) and supplying administrators with templates to assist and evaluate budding CSE programs in their schools. (FoSE 2012) These tools are available to any teacher or school who wishes to access them, yet they require bottom-up self-implementation and enforcement. FoSE does not explicitly provide funding or personnel for teacher training, only written materials. By contrast, Common Core is implemented top-down in schools and classrooms. Teacher participation is mandatory, and both teacher and student performance is evaluated by national tests that the state has adapted.
- The stakes and accountability are different. Because of the personal and social nature of sexual education, it’s harder to track successful implementation in the same way. A math test generally gives a pretty good sense of what math a student knows and how they will use it in the real world. A sex education test, even if it measured what a student knew, wouldn’t necessarily provide any insight into how that student would make decisions in the future. (Given some of the abstinence-only programs we examined previously, it wouldn’t take a genius to figure out ‘sex is bad, don’t have it’ is they key to a high score on a test in an abstinence-only school.) While the stakes of both are high, sex education is more about social skills and personal health than competition and employability.
- The National Sexuality Education Standards were created by non-profits. These standards are crafted to be national but have no explicit federal government ties or endorsements. By contrast, Common Core is written by a coalition of states and incentivized as part of Obama’s federal Race to the Top program, and is surrounded by a wide support web (funding, public relations, content contributions) of state governments, third party companies, and prominent individuals. (Bernd 2013)
These three key differences shed light on the most important difference between NSES and Common Core, namely that the latter has been widely adopted by states, and the former hasn’t: unlike Common Core, states have essentially no tangible incentive—that is, financial incentive—to adopt NSES. While Common Core is tied to a bundle of federal carrots including Race to the Top grants and Title I funding for struggling schools, the non-profits that created NSES cannot fund the implementation of CSE standards, much less fund rewards for implementing CSE standards. (Kertscher 2013) (Ravitch 2016)
It’s no secret that the current federal administration’s views on public schooling, women’s rights, public health, gender, and sexuality make for a bleak outlook for federally-incentivized CSE; an administration that recently attempted to revoke transgender students’ Title IX protections in public schools is highly unlikely to support CSE that includes discussion of sexuality and gender identity in the first place. (Peters et al. 2017) There are some arguments to be made for how nonprofit coalitions like FoSE could incentivize implementation: perhaps by reorganizing spending to offer aid to districts implementing CSE, or to broaden their coalitions (maybe to include for-profit allies) to increase funds and support, or to emphasize how CSE could ultimately lower costs for states and schools (decreases in teen pregnancy and STIs could potentially lessen government funds spent on public assistance and state-subsidized health services.) However, perhaps in the name of efficacy, national standardization isn’t the necessary route at all: the next section will explore the pros and cons of alternatives.
Evidence: City-Based Public CSE Projects, Chicago as a Model
We find ourselves in search of a middle ground: good sex ed is so important that it can’t depend solely on the luck of a good teacher (a fictional 2014 movie popularized this narrative, placing a virginal straight white male teacher in a majority Latinx school to ‘save’ their sex ed program) but there’s also evidence to suggest that federally and nationally implemented standardization is neither probable, enforceable, nor measurably effective. City-led CSE reform just might be the middle ground that is needed to balance some level of large-scale standardization with small-scale implementation.
Chicago Public Schools (CPS), the third largest public school district in the continental US, has led the way in forging CSE reform at the city level. The Chicago Board of Education effectively implemented NSES in CPS in February 2013, with no clear catalysts or financial incentives at the time. (CPS Policy Manual 2013) By May 2013, House Bill 2675 mandating “medically accurate, developmentally and age-appropriate” Comprehensive Health Education was passed by the Illinois General Assembly, and eventually signed into law by Governor Quinn; prior to this, Illinois had not mandated teaching sex education at all, and when provided, mandated medical and moralized stress on abstinence. (NCSL 2016) By June 2013, the Chicago Dept. of Public Health (CDPH) published a policy brief in support of the recent city and state reforms, lending its support to the CPS CSE rollout and announcing a federal Teen Outreach Program (TOP) grant jointly awarded to CDPH and CPS for their cooperation in reducing teen pregnancy.
Chicago is a remarkable case study for several reasons. First: Chicago is a rare example of where NSES standards and trainings have been explicitly adopted in actual classrooms. Second: this reform occurred at a time when the federal government was in fact increasing spending for abstinence-until-marriage programs by $75 million a year. (de Melker 2015) Third, and most importantly: although Chicago’s CSE initiative eventually received state and federal reinforcements (both legally and financially), this reform was city and district-led. Only after the district policies were enacted did state law and federal dollars follow suit.
Chicago’s road to CSE reform hasn’t been an entirely smooth one; it hit its most public snafu in November 2014, after parents encountered material that detailed “the basics of female condoms,” “feel-good reasons to use them,” and “other forms of contraception, sex toys and sex acts” in CSE curriculum materials for fifth and sixth graders. CPS responded with, “The objectionable material presented at Andrew Jackson Language Academy this week is not and never was part of the student sexual education curriculum. It was mistakenly downloaded and included in the parent presentation, and we agree with parents it is not appropriate for elementary school students.” (NBC Chicago 2014) Indeed, most parents involved in the controversy supported CPS’ CSE reforms, but were largely concerned with the age-appropriate timing of material rather than CSE itself.
Improvement of the initiative may require some ‘tinkering towards utopia’ (to use a choice phrase in educational reform), but on the whole, response has been positive. In December 2014, CPS Sexual Health Program Assistant Maalika Bannerjee wrote: “Though there are hiccups, and progress can take time, it’s happening. Even I, coming from a liberal school in Massachusetts, didn’t have a chance to discuss gender identity or consent or healthy decision making in the classroom. By 2015, students in over 600 CPS schools will be able to do just that.” In distinct difference from the mistaken material, her accounts detailed activities that were far more commonplace in CPS schools as a result of the rollouts: for instance, a teacher-training exercise where participants had to describe their weekend without using gendered language. Bannerjee writes,
“There’s a pause. I notice some teachers begin sentences, and then stop. But after a few minutes, the conversations begin to flow. At the end, I ask them how it went. One gym teacher said he struggled with the activity. ‘I said ‘I’ a lot, and it felt really impersonal,” he said. Another person chimed in with some alternatives; he suggested the use of “they” in place of “he” or “she,” and “partner” or “significant other” in place of “boyfriend” or “girlfriend.” Another teacher said the activity helped her think about how difficult it is for some LGBTQ students, who may need to revise their language in school to avoid harassment from their peers. And yet another person said it made him think about using more inclusive language in the classroom, to make all students feel safe and comfortable at school.” (Bannerjee 2014)
Although Chicago’s 2015 Youth Risk Behavior Survey (YRBS) data is not yet available to compare with 2013 data and gauge rollout effects, CPS has seen tangible positive impacts of the reforms in other ways. Some take the form of the classroom interactions like the one Bannerjee recorded above. Others take the form of student activism in the wider Chicago community. In December 2015, the Chicago Tribune reported on a 17-year-old CPS high schooler, Heaven Johnson, who partnered with the city’s Public Health Department to “launch a citywide safe-sex initiative that includes posters at CTA [metro] hubs and other parts of the city, a social media campaign (#ChicagoWearsCondoms) and volunteers periodically handing out free condoms.” Johnson’s efforts are quite literally seen all over the city, and her website directs citizens to “169 locations around Chicago that distribute free condoms, as well as addresses, phone numbers and hours for facilities that provide free sexually transmitted infection and HIV testing and treatment.” (Stevens 2015)

Figure 2. Photo from CPS high-schooler Heaven Johnson’s Chicago Wears Condoms Campaign. (Stevens 2015)
Conclusion
As with any policy model, city-led CSE reform is not proposed as a catch-all panacea to rescue America from sex ed’s victimization at the state and federal level. Some locations prove more difficult than others: for instance, in New Orleans, city-led CSE proposals faced similar roadblocks and backlash from the state level as state-led CSE proposals. (O’Donoghue 2015) Some locations don’t have the luxury of a school board large enough to encompass many schools nor formidable enough to spar with conservative municipal governments: persistent advocacy is still needed at the state level, especially to make sure rural students don’t ‘fall through the cracks’ of CSE reform.
However, I present the Chicago model as an exciting case where national CSE standards are actually starting to reach classrooms and have a positive impact on students as a result of localized bottom-up action. Despite initial state and federal resistance, Chicago’s great strides in CSE represent not only the potential of American cities, but indeed of public schools.
[Word Count: 3469]
Acknowledgments
Special thanks to peer editors Eliza Scruton and Molly Ono.
Works Cited
Advocates for Youth. Sex Education Programs: Definitions & Point-by-Point Comparison. Retrieved from http://www.advocatesforyouth.org/publications/publications-a-z/655-sex-education-programs-definitions-and-point-by-point-comparison
American Federation for Children. (2015, March 13.) Betsy DeVos SXSWedu. [Video file.] Retrieved from https://www.youtube.com/watch?v=f_2nH4aLLDc&feature=youtu.be
Bannerjee, M. (2014, December 30.) Taking Pride in Progress: Implementing Sex Ed in Chicago. Retrieved from http://nhc.networkforchange.org/chicago/blog/taking-pride-progress-implementing-sex-ed-chicago
Bernd, C. (2013, September 6.) Flow Chart Exposes Common Core’s Myriad Corporate Connections. Retrieved from http://www.truth-out.org/news/item/18442-flow-chart-exposes-common-cores-myriad-corporate-connections
beyonceVEVO. (2014, November 24) Beyoncé – ***Flawless ft. Chimamanda Ngozi Adichie. [Video file.] Retrieved from https://www.youtube.com/watch?v=IyuUWOnS9BY
Chicago Department of Public Health. (2013, June.) SEXUAL EDUCATION POLICY IN ILLINOIS AND CHICAGO. Retrieved from https://www.cityofchicago.org/content/dam/city/depts/cdph/CDPH/HCPolicyBriefJune2013.pdf
Chicago Public Schools Policy Manual. (2013, February 27.) Title: SEXUAL HEALTH EDUCATION; Section: 704.6; Board Report: 13-0227-PO1. Retrieved from http://policy.cps.edu/download.aspx?ID=57
Culp-Ressler, T. (2015, April 21.) One Woman Live-Tweeted Her Son’s Abstinence-Focused Sex Ed Class. Now Things Might Change. Retrieved from https://thinkprogress.org/one-woman-live-tweeted-her-sons-abstinence-focused-sex-ed-class-now-things-might-change-415fdd10b6e6
de Melker, S. (2015, May 27.) The case for starting sex education in kindergarten. Retrieved from http://www.pbs.org/newshour/updates/spring-fever/
Dreger, A. (2015, February 27.) Why Isn’t Sex Education a Part of Common Core? Retrieved from https://psmag.com/why-isn-t-sex-education-a-part-of-common-core-4a5b1a4deb7f
FoSE. (2012.) National Sexuality Education Standards. Retrieved from http://www.futureofsexed.org/nationalstandards.html
FoSE. (2012.) The National Teacher Preparation Standards for Sexuality Education: Tools for Implementation. Retrieved from http://www.futureofsexed.org/implementation.html
Guttmacher Institute. (2017, May 1.) Sex and HIV Education. Retrieved from https://www.guttmacher.org/state-policy/explore/sex-and-hiv-education
Holpuch, A. (2016, September 28.) US teenage birth rates fall again but still among highest in developed world. Retrieved from https://www.theguardian.com/us-news/2016/sep/28/us-teenage-birth-rates-fall-again
Kertscher, T. (2013, October 24.) How much is the federal government involved in the Common Core school standards? Retrieved from http://www.politifact.com/wisconsin/statements/2013/oct/24/sondy-pope/how-much-federal-government-involved-common-core-s/
Klein, R. (2014, April 8.) These Maps Show Where Kids In America Get Terrifying Sex Ed. Retrieved from http://www.huffingtonpost.com/2014/04/08/sex-education-requirement-maps_n_5111835.html
Labaree, D. (1997.) Public Goods, Private Goods: The American Struggle over Educational Goals. American Educational Research Journal 34(1):39-81.
LastWeekTonight. (2015, August 9.) Sex Education: Last Week Tonight with John Oliver (HBO). [Video file.] Retrieved from https://www.youtube.com/watch?v=L0jQz6jqQS0&pbjreload=10
Leip, D. (2016.) 2016 Presidential General Election Results. Retrieved from http://uselectionatlas.org/RESULTS/national.php
MLive. (2015.) Author tweets sex ed course at East Lansing school. Retrieved from https://storify.com/MLive/author-tweets-sex-ed-course-at-east-lansing-school
Moviclips Trailers. (2014, October 11.) Sex Ed Official Trailer #1 (2014) – Haley Joel Osment Movie HD. [Video file.] Retrieved from https://www.youtube.com/watch?v=j2vmzw9GjEo
National Conference of State Legislatures. (2016, December 21.) STATE POLICIES ON SEX EDUCATION IN SCHOOLS. Retrieved from http://www.ncsl.org/research/health/state-policies-on-sex-education-in-schools.aspx
NBC Chicago. (2014, November 14.) Parents Shocked by Material in Presentation on School’s New Sex Health Curriculum. Retrieved from http://www.nbcchicago.com/news/local/Parents-Shocked-by-Material-Mistakenly-Included-in-Presentation-on-Schools-New-Sex-Health-Curriculum-282788211.html
The New York Times. (2016, October 8.) Transcript: Donald Trump’s Taped Comments About Women. Retrieved from https://www.nytimes.com/2016/10/08/us/donald-trump-tape-transcript.html?_r=0
O’Donoghue, J. (2015, May 19.) New Orleans doesn’t get the sex education curriculum it wants. Retrieved from http://www.nola.com/politics/index.ssf/2015/05/new_orleans_sex_education_abst.html
Peters, J., Becker, J., & Hirschfield Davis, J. (2017, February 22.) Trump Rescinds Rules on Bathrooms for Transgender Students. Retrieved from https://www.nytimes.com/2017/02/22/us/politics/devos-sessions-transgender-students-rights.html
PhilanthropyRoundtable. (2013, Spring.) Interview with Betsy DeVos, the Reformer. Retrieved from http://www.philanthropyroundtable.org/topic/excellence_in_philanthropy/interview_with_betsy_devos
Planned Parenthood Federation of America. (2011, October 3.) New Poll: Parents are Talking With Their Kids About Sex but Often Not Tackling Harder Issues. Retrieved from https://www.plannedparenthood.org/about-us/newsroom/press-releases/new-poll-parents-talking-their-kids-about-sex-often-not-tackling-harder-issues
Planned Parenthood Federation of America. (2012, October 2.) Half of All Teens Feel Uncomfortable Talking to Their Parents About Sex While Only 19 Percent of Parents Feel the Same, New Survey Shows. Retrieved form https://www.plannedparenthood.org/about-us/newsroom/press-releases/half-all-teens-feel-uncomfortable-talking-their-parents-about-sex-while-only-19-percent-parents
Ravitch, D. (2016, January 22.) EXCLUSIVE: How Does ESSA Affect Opt Outs? Part 4. Retrieved from https://dianeravitch.net/2016/01/22/exclusive-what-does-essa-affect-opt-outs/
Semuels, A. (2014, April 2.) Sex education stumbles in Mississippi. Retrieved from http://www.latimes.com/nation/la-na-ms-teen-pregnancy-20140403-story.html
Shuger, L. (2012.) Teen Pregnancy & High School Dropout. Retrieved from https://www.americaspromise.org/sites/default/files/legacy/bodyfiles/teen-pregnancy-and-hs-dropout-print.pdf
SIECUS. Who Supports Comprehensive Sexuality Education? Retrieved from http://www.siecus.org/index.cfm?fuseaction=Page.ViewPage&PageID=1198
Stevens, H. (2015, December 3.) Chicago (and its skyscrapers) wear condoms, thanks to new campaign. Retrieved from http://www.chicagotribune.com/lifestyles/stevens/ct-chicago-wears-condoms-campaign-balancing-20151203-column.html
Fighting for a Future: The Massachusetts ‘No on 2’ Campaign and Its Impact on Public Education Advocacy
Daniel Vernick, May 2017
Fighting for a Future: The Massachusetts ‘No on 2’ Campaign and Its Impact on Public Education Advocacy
Executive Summary
The efforts of the Massachusetts Teachers Association (MTA), the main teacher union in MA and the central organizer of the 2016 anti-charter campaign, were instrumental to the success of the No on question 2 campaign. The campaign was a success due to its grassroots field operation, effective messaging, and community-based support, and can serve as a model for the public education movement in Massachusetts and across the country.
Introduction
In 2009, the MTA compromised on a deal in the MA legislature to raise the cap on charter schools. They did so because if the bill failed, it would go to a ballot measure – and, in a national atmosphere in which support for charters was rising among both Republicans and Democrats as well as championed by the Obama administration, the union leaders were convinced that such a ballot measure would pass and leave lasting damage on Massachusetts’ public schools. This changed with the election of Barbara Madeloni as MTA President. Madeloni believed in an forcefully progressive approach, a strategy that ended up working. Fast forward to 2016, and Madeloni decided to embrace the anti-charter campaign. According to the polls, which showed a landslide victory for the pro-charter side, many said she should invest union resources elsewhere. Question 2 ended up being defeated 62-38. The result was not only a landslide in public support away from charters but also a landslide of questions for pro-charter advocates, whose strategies largely failed. The result rejuvenated public education advocates and provides a route of resistance against the charter lobby that once seemed too powerful to resist, which is particularly relevant in the Trump-DeVos era.
Background
When Madeloni was elected, the MA legislature in 2014 was again about to raise the charter cap. Madeloni “urged her rank and file” to resist lifting the cap, which succeeded and showed the potential for grassroots organizing among public education advocates. The potential for a referendum was viewed as negotiating tool by the pro-charter side because it would allow for such a dramatic expansion in charters.[1] MA State Senate ended up passing the Rise Act, which tied charter cap increases to an increase in local education funding for 7 years and would cost 203-212 million per year.[2] The House decided not to compromise with the Senate on the bill and instead leave charters up to the voters, setting off the 2016 ballot campaign.
Madeloni’s willingness to take such a controversial issue head-on and success at mobilizing her membership was crucial. The result was that “teachers came out in force to talk to their neighbors,” and most people place high trust in teachers. One teacher said that their “neighbors looked to [teachers] as authorities on the issues involved in the ballot question, and greeted them warmly when approached to discuss” the anti-charter campaign[3] – a starkly different reaction than most political canvassers receive.
There are currently 78 charters in MA.[4] The current charter cap allows for 120, with 4-5 approved each year. The cap also includes a limit on the percentage of school budget spent on charters, preventing districts from spending more than 9% of their budget–and 18% in low-performing districts–on charters. In cities such as Boston, Lowell, and Springfield, the financial limit has resulted in waiting lists. In 2010, a “smart cap” was instituted. This prioritizes charter applications from CMOs “with a proven track record that seek to expand in low-performing districts.” Still, the charter cap has limited charters in many cities, with tens of thousands of students on waitlists.[5] Question 2 would allow an additional 12 charters per year for an unlimited number of years.
Top in the Nation: Massachusetts Charter Schools
The pro-charter campaign centered on the fact that MA charters are some of the highest performing in the nation and have avoided the scandals than plauge those in other states. A recent Brookings report claims that MA urban charters have positive student outcomes and increase the performance of low-performing students. The MA charter application process “is one of the most rigorous in the country,” which is shown by the closure of 17 charter schools “deemed ineffective or mismanaged” since 1997.[6]
DESE reviews all applications for MA charters. This centralized system allows for universal standards to hold charters accountable and is starkly different from other states, allowing for high performance.[7] Attending a Boston charter for one year results in a substantial increase in test performance and eliminates 1/3 of the “racial achievement gap.”[8] Competition among charters is part of the reason why MA charters are high-performing, and therefore the anti-charter side argued that drastically decreasing competition would have negative effects on charter quality.
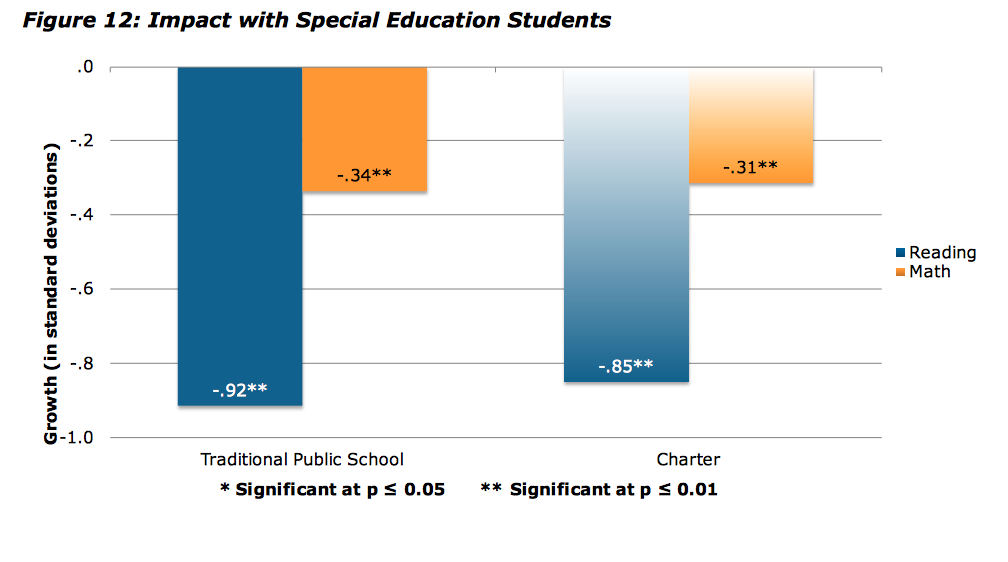
Figure 1
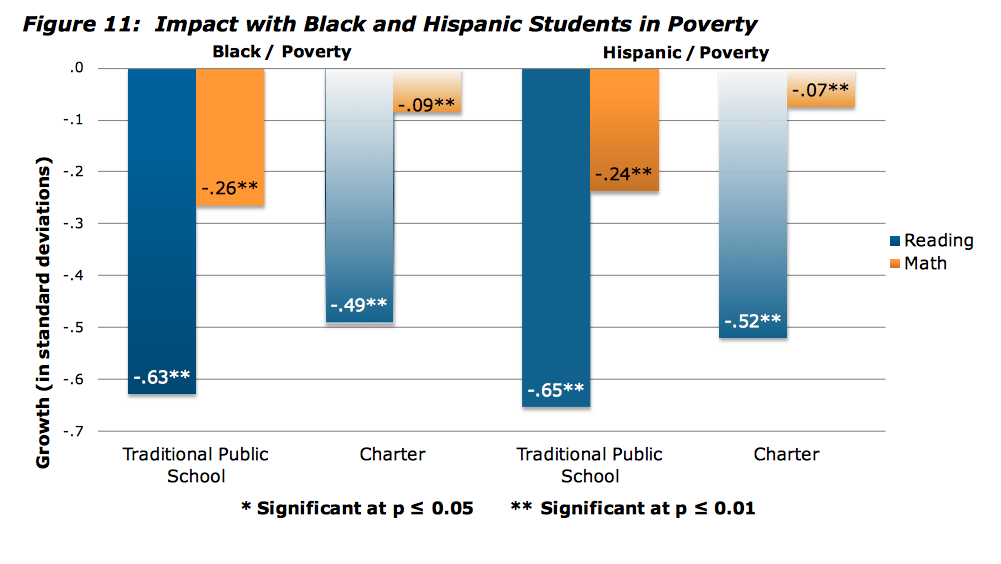
Figure 2
“Great Schools” or “Save Our Public Schools”: Campaign Messaging and Arguments
Charter supporters planned a three part strategy. First was the legislative effort, then a ballot question, and the third alternative was a lawsuit using an elite Boston law firm to “file a class-action suit to lift the charter cap” because “it unconstitutionally denies children access to an adequate education.”[9] Great Schools MA was the umbrella pro-charter campaign committee. Families for Excellent Schools (FES) was the primary organization under the umbrella. FES is a “powerful pro-charter force in NYC,” and opened a branch in MA solely to lobby for question 2. FES is funded by Wall Street donors, many of whom would benefit financially from increased charters. It claims to be grassroots and parent-based, but the reality is that “a small group of charter school chains, politically connected Wall Street financiers, and powerful education officials have controlled FES since its founding.”[10] In New York, FES organized public displays of pro-charter activism, such as 30,000 people marching across the Brooklyn Bridge; “theirs is a powerful spectacle, until one looks too closely and notices that the guys on the walkie talkies are all white and that the parents were told that they had to attend.”[11] MA Secretary of Education James Peyser was on the board of FES as well as a “managing partner of New School Venture Fund,” which is “among the first and largest investors in charter schools and the first to support multi-site” CMOs. Therefore he had a direct interest in passing question 2. Furthermore, as Executive Director of the Pioneer Institute, Peyser also “helped craft a strategy for the charter expansion forces” in MA.[12] FES failed due to its vague messaging that shied away from explicitly stating its goal of pushing charters, instead beginning its work in Boston with a “lavishly choreographed rally” at Faneuil Hall. The rally did not mention charter schools at all.[13]
There were also Massachusetts-based groups under the Great Schools MA umbrella. Democrats for Education Reform (DFER) and the MA Charter Public School Association both poured in money. DFER’s first ominous sign occurred in the September 9th Democratic primary for a State Senate seat in Cambridge and Somerville. The race pitted anti-charter State Senator Pat Jehlen against pro-charter Cambridge City Councilor Leland Cheung. Cheung was closely connected with DFER, who funded his campaign. In response, MTA contributed a smaller amount to Jehlen’s campaign. Jehlen challenged DFER President Liam Kerr to a debate, stating that Kerr is her real opponent. Kerr agreed, and the election became a referendum on charter schools. Cheung ended up losing with just 20% of the vote to Jehlen’s 80%. DFER and the pro-charter lobby claimed that this vote was an outlier that did not represent the opinion of MA voters. Yet they made very similar statements after losing question 2; there is a clear trend and roadmap to oppose charters. These are not isolated losses, but rather a growing fundamental distrust of charter schools that will further manifest itself in the coming years.
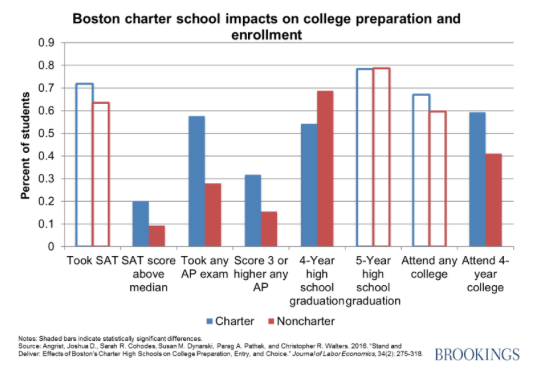
Figure 3
The pro-charter campaign kept switching tactics, unable to settle on a central message that worked. Its chaotic messaging contrasted with the No campaign’s straightforward and concrete central message of district school funds being funneled to charters. That argument was reinforced by the hundreds of School Committees across MA that passed resolutions opposing question 2 because they knew firsthand how much money was lost to charters. As polls showed the yes side losing, the Yes side began to directly contradict the No side’s argument, “airing ads saying that charter schools would provide more money for public education.”[14] Another central pro-charter campaign argument was the waitlist, which changed during the campaign due to the MA Department of Elementary and Secondary Education (DESE) releasing a waitlist number that was artificially high. State Auditor Suzanne Bump said that “DESE had overstated the waitlist by an indeterminable amount by rolling over entries from prior years who may no longer be interested.”[15] Not everyone on a waitlist actually wants to go to that school; often students are placed on multiple waitlists so that parents retain a variety of options.[16] Normal public schools also have waiting lists, particularly in places like Boston. These waitlists are unable to “be as expansive as charter waitlists, since they’re only held till January” and do not roll over.[17] Since MA was ranked first in student achievement, and also because 96% of public school students in MA attend normal public schools, voters were generally positive toward the MA education system.[18] MA Parent Teacher Association and MA Municipal Association both officially opposed question 2.[19] These are well-respected and nonpartisan organizations that send a message of bipartisan opposition.
According to a Brookings study, charters in low-income and high-minority urban areas “have large, positive effects on educational outcomes” that are better than in district schools, and those effects are “particularly large for disadvantaged [and] SPED students” (see figures 1-3).[20] Another recent study showed that Boston charters that opened new schools after the cap was raised in 2010 “were able to maintain their strong results.”[21] On the other hand, students in rural and suburban charters “do the same or worse” than students in district schools.[22] The charter cap does not currently affect expansion of schools in suburban and rural areas, as they have not reached the cap.
The pro-charter side’s argument centered on ensuring that all students have access to a quality education. They argued that the referendum would modestly increase charters, and one ad even ended with “Yes on 2: for stronger public schools.”[23] Boston Mayor Marty Walsh, a traditional charter supporter and former member of the board of a Boston charter,[24] opposed the ballot question due to the “pace and scope” of charters that the referendum would allow for. He called the referendum “a looming death spiral aimed squarely at the most vulnerable children in our city.”[25] Sweeney, the Boston finance chief, agreed and thought that 12 new charters per year could “nearly eliminate the Boston Public Schools.”[26] If only 3 new charters were approved each year in Boston over the next decade, the Boston funds going to charters would increase from 5 to 20 percent. Charter advocates responded by saying that Boston has to “be responsible for getting its own fiscal house in order,” and that the city will have to close schools.[27] Nonpartisan city officials and financial watchdogs agreed with the No on 2’s argument that the increase in charters would drain dangerous amounts of money from public schools.
In Lowell, the cost of charters rose by 8.6 million over the past 9 years, but the state funding has stayed flat. Disproving another central Yes on 2 argument, “the charter school waitlist in Lowell…is dwarfed by the number of kids waiting to get into district schools.”[29] Lowell ended up voting against charters by 56.8 to 43.2.[30] The No side’s arguments spread far beyond education advocates to reach the average voter.
The No campaign “successfully connected charter school expansion to dark money and to a market-based ideological agenda,” revealing the Wall Street businessmen, conservatives, and New Yorkers that they argued were pouring money to dictate what’s best for Massachusetts. Since 2010, cities such as Boston, Fall River, and Lawrence have had an increase of 83% in charter spending but only 15% increase in state education aid. This results in money taken from other portions of the city budget, and the cities affected already have some of the highest poverty rates in the Commonwealth.[31] Due to overhead costs such as building maintenance and transportation, schools may “not be able to adjust to the loss of revenue” to charters.[32] Moody’s Investors Service agreed that passage of question 2 would be “credit negative” for the cities of Boston, Springfield, Lawrence, and Fall River.[33] The yes campaign responded by denying these concerns, stating that charters have “zero impact on district school finances.”[34] After question 2’s failure, Moody’s said that that result is “credit positive” for MA cities.[35]
The Yes side’s financial dominance allowed it to air an unprecedented amount of ads for a ballot campaign. One frequently aired ad consisted of Governor Baker saying, “Imagine if your kid was trapped in a failing school,” reaching for the emotions of white suburban voters to do what’s right for Black and Latino children in inner cities, whose images flash across the screen. Another ad said that it’s critical to raise the cap in order to remove what it claimed to be 37,000 students off charter waiting lists in MA. Great Schools MA’s TV ads “contain several themes from the pro-charter playbook,” and therefore the failure of this messaging means that it can also fail in future campaigns. For instance, the Boston Globe op-ed supporting question 2 emphasized students “languishing on waitlists.”[36] Good aspects of the traditional system “were generally portrayed as exceptions in a failing system,” which is false in Massachusetts’s top in the nation system. Since MA students rank first in the nation, voters are likely to oppose any drastic changes to the current system; the No campaign’s portrayal of the Yes side as extremist led many traditionally pro-charter politicians to take what they perceived to be the safer option and oppose question 2, thus shifting public opinion.
The most senior education officials in America backed the pro-charter narrative, with Secretary of Education John King, Arne Duncan, as well as Congressman Stephen Lynch, and Speaker DeLeo in MA. They joined together to attempt to unite the Democrats in an ad titled “Real Democrats are YES on Question 2.”[37] The No side included many politicians and officials who had traditionally been pro-charter. Mayor Walsh’s opposition to question 2 sent a clear message that opposing drastic expansion of charters does not mean one has to oppose charters themselves. Walsh opposed question 2 due to the deep budgetary implications it would have on Boston Public Schools. Mobilizing pro-charter politicians to oppose question 2 by depicting it as radical was a critical strategy; “more charter supporters recognize that Question 2 is the wrong solution” due to the dramatic increase of charters allowed as well as the lack of local control.[38]
In 2015, 412 million was taken from the 243 school districts and given to charters.[39] The No campaign successfully encouraged conversations with friends and neighbors about how much will be lost to charters if the number of charters dramatically increases. They emphasized the fact that 12 new charters per year would in 10 years nearly triple the number of MA charters. Furthermore, the dropping of the limit on the amount that a district could lose to charters could effectively eliminate public education in certain cities.[40]
A Skewed Budget: Financial Aspects of the Referendum Campaign
The Yes side spent $23.6 million to the No side’s $14.1 million,[41] making it the most expensive referendum campaign in MA history. The top 5 yes campaign donors were FES, followed by Alice Walton, the group Strong Economy for Growth, Jim Walton, and Michael Bloomberg. In contrast, the no campaign’s top donors were MTA, NEA, AFT, and AFL-CIO.[42] Local teacher unions in cities and towns affected by charters, such as Boston, Lowell, and Lawrence, also donated thousands.[43] Massachusetts corporations MassMutual Financial, State Street Bank, EMC Corporation, and Vertex Pharmaceuticals all contributed to Great Schools MA.[44] Wealthy out-of-state donors also poured money into the pro-charter effort; Arkansas residents and Walmart heirs Alice and Jim Walton donated $1.8 million while Michael Bloomberg gave $490,000.[45] FES poured 17 million to the Yes campaign but is not required to disclose donors and is registered in New York.[46] For “average voters…the outsized role being played by rich New Yorkers was utterly incomprehensible.”[47] $778,000 was also donated by bankers that manage MA pension funds to question 2.[48] The No campaign successfully crafted a narrative that conveyed the fact that wealthy, white out-of-state donors thought they knew what type of education was best for Massachusetts’ inner-city children. New England NAACP president and No on 2 campaign chair Juan Cofield said that “this is a truly unprecedented financial push by the charter industry to buy our election with untraceable money.”[49] The MA Charter Public School Association said that the out-of-state money from financial executives is essential to combating the financial power of teacher unions, despite the fact that the No side had nearly half the money of the Yes campaign.
The well-funded campaigns produced many TV ads and direct mail, which resulted in many more voters paying attention and thus more likely to make an informed choice. Opposition to charters became more than a niche issue. Undecided voters realized that there was “something fishy” about the Yes on 2 campaign’s seemingly constant back-to-back TV ads. This suspicion was confounded by additional deceptive tactics; for instance, one of the five pro-charter campaign committees was called, “Advancing Obama’s Legacy on Charter Schools Ballot Committee,” tying the yes campaign to Obama despite the fact that he did not weigh in on either side.[50]
Leading the Opposition: The Role of Teacher Unions in the Campaign
For the past few decades, teacher unions had been on the defensive about charters. But throughout the campaign, unions–particularly the MTA under Barbara Madeloni–were on the offensive. It was reported that $778,000 was donated to Great Schools MA by “executives from eight financial firms that hold management contracts with the state pension fund,” which is led by strong charter-supporter and popular Republican Governor Charlie Baker.[51] MTA and AFT-MA filed with the SEC to call for federal and state investigation into hedge fund managers’ donations to the yes campaign. Those executives cannot donate to Baker’s campaign due to campaign finance regulations, but they are able to donate to the pro-charter campaign and thus gain favor with him. Campaign finance experts said that this is a way for executives to “legally circumvent pay-to-play rules.”[52] Madeloni was on offense in a statement, saying, “it is appalling that ads starring [Baker] are being financed by donations from Wall Street fund managers who have an interest in currying favor with the administration.”[53] Baker called it a “distraction.”[54] While the investigation did not go anywhere, it obtained negative media coverage for the pro-charter campaign and contributed to the public perception of the Yes side being funded by wealthy donors disconnected from Massachusetts communities.
NEA President Lily Garcia said, “This is really important for us.” NEA’s 3 million members make it the largest union in America, and thus its backing carries substantial weight. Politico wrote before the election that the failure of question 2 would be “a significant symbolic coup for teachers unions.”[55] Failure of question 2 would also “deter other states from considering [charter] expansions amid signs the anti-charter side is gaining momentum.” The union’s first victory came in the form of the Democratic Party platform at the 2016 convention, which, at the personal request from AFT President Randi Weingarten, was amended to be more anti-charter than ever.[56] The grassroots no on 2 campaign was driven by local teacher unions, which are present in every district and are run and staffed almost entirely by teachers in that district. For instance, Belmont Education Association (BEA) handed out anti-charter flyers containing the BEA logo at major Belmont events. Parents’ “conversation with local teachers played a central role in building opposition.” One voter said that teachers in her town of Brookline “are the ones who really made up my mind.”[57] A variety of other unions, from AFSCME to CWA, joined the teacher unions to form a broad labor coalition under the SOPS umbrella, expanding the grassroots reach of the anti-charter effort.
The pro-charter side claimed that teachers were pressured by the union to oppose question 2. One teacher said that on the first day of her job, all teachers met in the auditorium. The local union president then gave a speech about the No campaign, and slips of paper were passed out to sign up for the No campaign.[58] Others argue that it’s a “lazy script” to simply attribute defeat of question 2 to teacher unions. In reality, “the vote…represents a political realignment” on the charter issue due to progressives firmly united against them.[59] People on the ground understood this, though those out-of-state were disconnected and thus “stunned when Elizabeth Warren announced she was No on 2,” failing to understand the degree of the realignment.
From the Bottom Up: Grassroots Organizing and the Leadup to the Question 2 Vote
Save Our Public Schools (SOPS) was the No campaign’s umbrella organization, which itself is a more direct branding than the vague name Great Schools MA. Organizations under the umbrella included MA Teachers Association, AFT Massachusetts, New England NAACP, Citizens for Public Schools, MA AFL-CIO, and other community groups.[60] The role of unions as running the No campaign, a narrative promulgated by the Yes campaign and mainstream media, is “exaggerated.” Teacher unions “were only one component of a broad-based and diverse No coalition.” Unpaid volunteers “did a staggering amount of work.” For instance, parents in Boston alone were organized into the group Quality Education for Every Student, which ran “highly organized” canvasses and phone banks consistently throughout the summer and through election day.[61] Anti-charter volunteers contacted 378,000 households in Boston while the Yes campaign contacted 150,000 in Greater Boston.[62] Average people took it upon themselves to help out the No campaign; for instance, parents made videos that went viral on social media, and volunteers “turned their homes into makeshift call centers” to phone bank. Many students also contributed by canvassing, phone banking, and using the infrastructure built during their 2016 budget walkout.[63] “The coalition extended well beyond teacher unions”[64] to include civil rights groups and social justice organizations. All of these groups “fanned out across the state every weekend” to spread the word. The No campaign canvassed 1.5 million voters–a stunning figure for a referendum campaign–and the final tally was 2 million votes against the measure. Therefore grassroots campaigning truly did make a large difference, and the victory indicates “the potential of substantial pushback against the corporate agenda from coordinated grassroots organizing.”[65]
The Yes campaign had far fewer people canvassing, phone banking, and spreading the word via social media.[66] Their “grassroots” field operation was actually made up almost entirely of people who were paid to knock doors, make phone calls, hold signs, and poll watch. Many were not even from MA. The campaign attempted to portray an image of being driven by support from low-income, inner-city people of color. A few parents of color, whose children went to Boston charter schools, spoke at highly choreographed Yes on 2 rallies to portray an image of African-American support. In the end, it was impossible to create support where it didn’t exist. The rallies and support for the No on 2 campaign were less scripted and more genuine.
215 School Committees passed resolutions opposing question 2, highlighting the loss of funds to their district schools and thus reinforcing the No campaign’s central argument. They also emphasized the lack of ELL and SPED resources in charters, which leave district schools to take on the burden of financing those more expensive students. Because the resolutions were passed consistently from the spring through the November election, they provided the No campaign with a “strong sense of momentum” that was publicized in order to control the media narrative.[67] Each local school board resolution resulted in media coverage in each city and town, and allowed local canvassers and phone bankers to gain traction. Use of school boards could be an impactful strategy in the success of future campaigns.
Racial Aspects and the African-American Mobilization Against Question 2
Black and Latino parents organized in their communities through groups such as the NAACP, Black Educators Alliance of MA, and Union of Minority Neighborhoods.[68] NAACP not only endorsed No on 2 but was a direct member of the campaign committee, and Juan Cofield–NAACP New England President and SOPS chair–was the public face of the No campaign. This was critical not only in turning a substantial constituency against charters, but also in showing that the Yes campaign’s narrative of voting yes to support inner-cities is backward because inner-city voters overwhelmingly opposed question 2. A few months before the vote, the NAACP convention voted for a moratorium on charters expansion “until they adopt the same level of oversight, civil rights protections, and transparency as public schools.”[69]
Some black pro-charter organizations opposed the NAACP position, such as the Black Alliance for Educational Options and African-American Boston newspaper Bay State Banner.[70] The Yes campaign used tactics with underlying racial motives; for instance, they sent a mailing covered by a picture of President Obama, with text that said “preserve Obama’s education legacy,” yet Obama was never involved in either side. FES created a group called Unify Boston, which spent months getting signatures from parents of color who wanted “great neighborhood schools.” Yet when the leaders told the signature gatherers “that the actual goal of the campaign was to lift the charter cap, a revolt broke out.” A former organizer remarked, “It’s like they think people of color are stupid.”[71]
Black politicians such as Boston City Councilor Tito Jackson and Boston NAACP President Michael Curry played a prominent role in mobilizing their community against question 2. Both represented the No side in debates, attended rallies, and served as “go-to persons for Boston newspaper articles on the campaign.”[72] They showed the depth of No campaign’s support in the black community, rather than the artificial image of support that the Yes campaign attempted to portray.
In areas of Boston like Mattapan, with some of “the lowest performing schools in the state, opposition to Question 2 ran deep,”[73] with many people repulsed by outsiders believing they knew best without actually being on the ground in the community. Boston NAACP president Michael Curry said that “communities of color spoke loudly.”[74] Some of the most emphasized pro-charter arguments highlighted the need to support students of color in failing schools. For instance, one journalist wrote a piece titled, “It’s Heartbreaking’: Boston Parents Ask Why Their Wealthy Neighbors Are Fighting Charter Schools.”[75] This piece tried to portray charters as supported by people of color who live in areas with the highest concentration of charters. But the overwhelming 2 to 1 opposition in those areas showed the opposite; the landslide against charters in inner-city Boston is even a larger margin than the statewide result.[76] Civil rights leaders “say families of color yearn for something deeper [than charters]: A plan to improve the quality of education…so they don’t need alternatives.”[77]
A New Era: Democratic Party Solidarity Against Question 2
Democrats and Republicans initially supported question 2 in similar numbers.[78] In the final vote, Democrats opposed it overwhelmingly. At the June 4th, 2016 MA Democratic State Convention, an event I attended, “Save Our Public Schools” signs abounded despite the fact that the question had not yet even been certified for the ballot. Signatures were submitted by the pro-charter campaign on June 22nd, and the question was certified on July 6th.[79] Pro-charter forces also made a massive push for Democratic delegates and activists. DFER, for instance, was the only outside group to send an official mailing to delegates prior to the state convention. That mailing was an invitation to a DFER breakfast for delegates, which had elaborate food and was attended by pro-charter state legislators. SOPS did not have a breakfast, but it was clear at the convention that they had the people. Numerous SOPS tables appeared throughout the convention hall, and anti-charter stickers were a near-constant sight on delegates while hardly any pro-charter stickers could be spotted. DFER also paid for multiple breakfasts–which cost around $5000 each–at the Democratic National Convention,[80] attempting to portray an image of support for charters in MA.
The No on 2 campaign “tapped into genuinely viral energy.” This spurred the MA Democratic Party to officially oppose question 2, which likely would not have happened without the enormous grassroots mobilization. This stance against charters is at odds with some Democratic legislators, including Speaker DeLeo.[81] Bernie Sanders and Elizabeth Warren both endorsed the anti-charter campaign. Warren echoed the central argument of the anti-charter campaign, saying that more charters would damage the education of “students in districts with tight budgets where every dime matters.” She emphasized that 400 million was taken from public schools to charters, resulting in cuts to district schools including “in arts, technology, AP classes, preschool, bus service, and more.”[82] In a blue state like MA, Democratic unity contributed greatly to the No campaign’s landslide victory.
Crossing the Partisan Divide to Oppose Charters: Geographic Trends in the Election Results
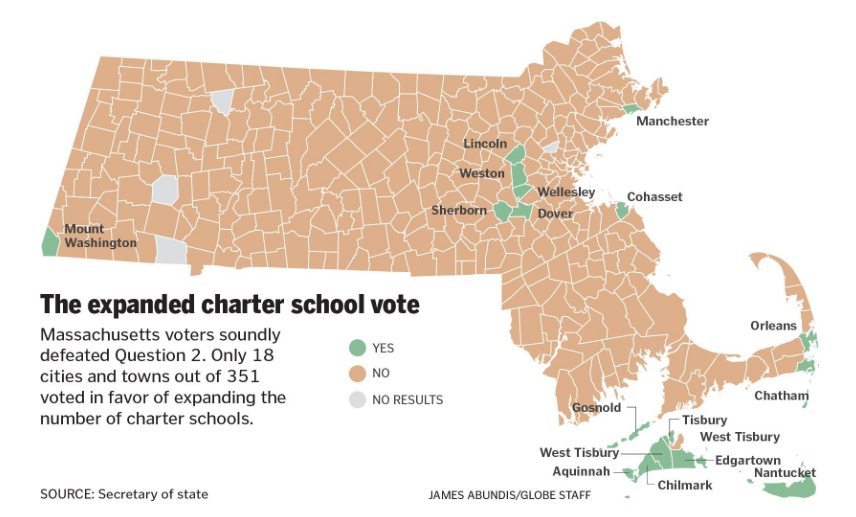
Figure 4
The anti-charter effort was victorious in almost every town in Massachusetts. The few towns that voted yes were also some of the wealthiest in Massachusetts. Weston, easily the wealthiest town with median household income of $201,200,[83] voted 60-40 in support of charter schools, the second highest margin in the state (the highest was 61-39 in Aquinnah, a tiny affluent community on Martha’s Vineyard).[84] Dover, the second wealthiest town, voted 58.7 to 41.3 for charters, the third highest pro-charter margin in the state. Sherborn, with the fifth highest pro-charter margin, is also the fifth wealthiest town. There is a clear correlation between the wealthiest towns and the highest pro-charter margins. The exclusive affluent communities of Nantucket and Martha’s Vineyard supported charters. On Martha’s Vineyard, wealthy white Edgartown and Chilmark voted yes, while the heavily African-American community of Oak Bluffs voted no, signaling that pro-charter support among the wealthiest Bay Staters was limited to whites.
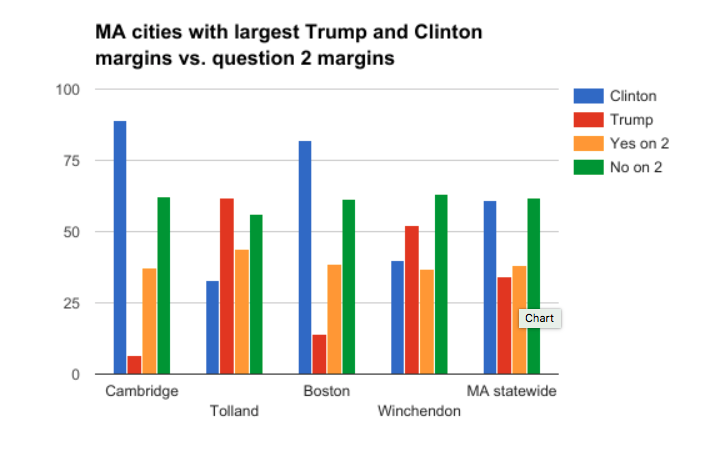
Figure 5
Towns that voted for Trump by high margins also voted against charters by margins similar to those in Boston, Worcester, and other liberal cities. For instance, Tolland had the highest margin for Trump and Cambridge had the highest margin for Clinton, but their charter margin was remarkably similar. This implies that Trump-DeVos education policies are not popular with his white working class base, and therefore it’s critical for public education advocates to mobilize that group in order to most effectively resist. The No campaign’s tactic of grassroots outreach in all areas of the Commonwealth succeeded even in white, working-class, Trump supporting areas and therefore a similar anti-charter strategy can be successfully applied across the Midwest and throughout the country. The statewide trend was replicated along wealth lines in Boston itself. The largest anti-charter margin occurred in the predominantly low-income and African-American area of Roxbury while the highest margin in support of charters occurred in the wealthy and white Back Bay.[85] The coalescence of the black community around the anti-charter campaign was reflected in the inner city vote total, with Roxbury, Mattapan, and Dorchester all voting around two to one against question 2. All cities and towns with a large number of charter schools voted against question 2. In fact, no town that voted for charters has a single charter school.
A Model for the Nation: Applying Lessons from the Massachusetts Anti-Charter Campaign to Future Public Education Advocacy
The day after the vote, the Boston Globe headline read, “Crushing defeat leaves charter-school movement in limbo.”[86] This “exceeded the worst case scenario” of charter supporters. One researcher at a pro-charter thinktank acknowledged that the anti-charter side came out ahead on every argument.[87] The No side gained the upper hand because it convinced undecided voters while the Yes side hardly expanded its base. DFER was “quick to issue statements of “we’ll be back – talking-pointed bravado…that conveyed nothing so much as a failure to recognize the magnitude of their loss.”[88] Charter advocates say not to read into the vote. But according to the National Education Policy Center, “the MA campaign suggests that the neoliberal, pro-charter narrative” is ending.[89]
MA’s vote against charters was immediately lauded nationwide as a major step in stopping the tide of charters.[90] Diane Ravitch noted that “this was the first contest over charter schools in which the key issues became public,” highlighting million-dollar donations from financial executives.[91] The Yes effort backfired by creating their worst nightmare, uniting progressives and Democrats against charter schools and into a powerful grassroots force that will continue to fight charters across MA; “all of the momentum is on the [anti-charter] side now.”[92]
Race was a critical aspect. Importantly, the “strong and visible black support for the No campaign upended the Obama-era consensus of broad, bipartisan support for charter schools.”[93] The MTA was the lead organizer in creating the No campaign and its successful strategy. MTA President Madeloni’s decision to pull all the stops on the anti-charter campaign was controversial even within the MTA itself. But her decision to go all-out arguably made all the difference. Teachers and their local unions powered much of this campaign, leading canvasses door to door in every area of the Commonwealth. Teacher unions now have more leverage and will take a broader role against charters in the Trump era.
The landslide victory against charters, and the campaign that made it happen, was unprecedented and lays the path for future resistance to charters. The same tactics and messaging, from coalescing support from the black community to organizing on a grassroots level, can be used not just on other charter school ballot campaigns but also on resisting charters at the legislative level and in other capacities. In the Trump-DeVos era, the No on 2 campaign’s success forms the blueprint for resistance to the privatization of public education.
1. Rinaldi, Jessica. “How Many Charter Schools Are Too Many? – The Boston Globe.” BostonGlobe.com. 03 Nov. 2016. Web. 28 Apr. 2017.
2. Mass. Democrats Vote To Oppose Charter School Question. (n.d.). Retrieved May 03, 2017.
3. Blum, L. What we can learn from the Massachusetts ballot question campaign on charter school expansion. National Education Policy Center.
4. Schoenberg, S. S. (2016, November 15). Moody’s: Vote against charter school expansion ‘credit positive’ for Massachusetts cities like Springfield.
5. Cohodes, S., & Dynarski, S. M. (2017, March 29). Massachusetts charter cap holds back disadvantaged students | Brookings Institution. Retrieved May 03, 2017.
6. Ibid.
7. Ibid.
8. Ibid.
9. Jennifer Berkshire. “What Went Down in Massachusetts – Have You Heard.” Have You Heard. Web. 28 Apr. 2017.
10. Blum, L. What we can learn from the Massachusetts ballot question campaign on charter school expansion. National Education Policy Center.
11. Jennifer Berkshire. “What Went Down in Massachusetts – Have You Heard.” Have You Heard. Web. 28 Apr. 2017.
12. Blum, L. What we can learn from the Massachusetts ballot question campaign on charter school expansion. National Education Policy Center.
13. Jennifer Berkshire. “What Went Down in Massachusetts – Have You Heard.” Have You Heard. Web. 28 Apr. 2017.
14. Davis, J. (2016, November 10). Crushing defeat leaves charter-school movement in limbo – The Boston Globe.
15. Blum, L. What we can learn from the Massachusetts ballot question campaign on charter school expansion. National Education Policy Center.
16. Ibid.
17. Ibid.
18. Why Question 2 grassroots opposition is growing. (2016, August 29). Retrieved April 28, 2017.
19. Ibid.
20. Cohodes, S., & Dynarski, S. M. (2017, March 29). Massachusetts charter cap holds back disadvantaged students | Brookings Institution. Retrieved May 03, 2017.
21. Rinaldi, Jessica. “How Many Charter Schools Are Too Many? – The Boston Globe.” BostonGlobe.com. 03 Nov. 2016. Web. 28 Apr. 2017.
22. Cohodes, S., & Dynarski, S. M. (2017, March 29). Massachusetts charter cap holds back disadvantaged students | Brookings Institution. Retrieved May 03, 2017.
23. Why Question 2 grassroots opposition is growing. (2016, August 29). Retrieved April 28, 2017.
24. Ibid.
25. Rinaldi, Jessica. “How Many Charter Schools Are Too Many?” The Boston Globe. BostonGlobe.com. 03 Nov. 2016.
26. Ibid.
27. Ibid.
28. Ibid.
29. Jennifer Berkshire. “What Went Down in Massachusetts – Have You Heard.” Have You Heard. Web. 28 Apr. 2017.
30. “Massachusetts Question 2 – Expand Charter Schools – Results: Rejected.” The New York Times. The New York Times. Web. 03 May 2017.
31. Schoenberg, S. S. (2016, November 15). Moody’s: Vote against charter school expansion ‘credit positive’ for Massachusetts cities like Springfield.
32. Ibid.
33. Staff, G. (2016, November 02). Charter school vote may hurt credit ratings, Moody’s warns Boston, 3 other cities – The Boston Globe.
34. Ibid.
35. Schoenberg, S. S. (2016, November 15). Moody’s: Vote against charter school expansion ‘credit positive’ for Massachusetts cities like Springfield.
36. Blum, L. What we can learn from the Massachusetts ballot question campaign on charter school expansion. National Education Policy Center.
37. Hefling, K. (2016, November 04). Democrats feud over charter schools in Massachusetts. Retrieved May 03, 2017.
38. Why Question 2 grassroots opposition is growing. (2016, August 29). Retrieved April 28, 2017.
39. Ibid.
40. Ibid.
41. Shira Schoenberg. “Who Is Funding Massachusetts Question 2, on Charter School Expansion?” Masslive.com. 05 Nov. 2016.
42. Massachusetts Authorization of Additional Charter Schools and Charter School Expansion, Question 2 (2016).
43. Shira Schoenberg. “Moody’s: Vote against Charter School Expansion ‘credit Positive’ for Massachusetts Cities like Springfield.” Masslive.com. 15 Nov. 2016. Web. 28 Apr. 2017.
44. Shira Schoenberg. “Who Is Funding Massachusetts Question 2, on Charter School Expansion?” Masslive.com. 05 Nov. 2016.
45. Ibid.
46. Shira Schoenberg. “Moody’s: Vote against Charter School Expansion ‘credit Positive’ for Massachusetts Cities like Springfield.” Masslive.com. 15 Nov. 2016. Web. 28 Apr. 2017.
47. Jennifer Berkshire. “What Went Down in Massachusetts – Have You Heard.” Have You Heard. Web. 28 Apr. 2017.
48. Shira Schoenberg. “Moody’s: Vote against Charter School Expansion ‘credit Positive’ for Massachusetts Cities like Springfield.” Masslive.com. 15 Nov. 2016. Web. 28 Apr. 2017.
49. Ibid.
50. Massachusetts Authorization of Additional Charter Schools and Charter School Expansion, Question 2 (2016).
51. Schoenberg, S. S. (2016, November 01). Teachers unions file complaint over ‘pay-to-play’ allegations involving charter school supporters.
52. Ibid.
53. Ibid.
54. Ibid.
55. Hefling, K. (2016, November 04). Democrats feud over charter schools in Massachusetts. Retrieved May 03, 2017.
56. Ibid.
57. Ryan, D. L. (2016, October 18). On charter schools, a new partisan divide – The Boston Globe. Retrieved May 03, 2017.
58. Crookston, Paul. “Massachusetts Teachers Pressured by Union Leaders to Oppose Charter Schools.” National Review. 07 Nov. 2016.
59. Jennifer Berkshire. “What Went Down in Massachusetts – Have You Heard.” Have You Heard. Web. 28 Apr. 2017.
60. Blum, L. What we can learn from the Massachusetts ballot question campaign on charter school expansion. National Education Policy Center.
61. Ibid.
62. Vaznis, James. “In Boston, Charter Vote Reflected Racial Divide – The Boston Globe.” BostonGlobe.com. 14 Nov. 2016. Web. 28 Apr. 2017.
63. Blum, L. What we can learn from the Massachusetts ballot question campaign on charter school expansion. National Education Policy Center.
64. Jennifer Berkshire. “What Went Down in Massachusetts – Have You Heard.” Have You Heard. Web. 28 Apr. 2017.
65. Blum, L. What we can learn from the Massachusetts ballot question campaign on charter school expansion. National Education Policy Center.
66. Ibid.
67. Ibid.
68. Ibid.
69. Strauss, V. (2016, October 15). NAACP ratifies controversial resolution for a moratorium on charter schools.
70. Blum, L. What we can learn from the Massachusetts ballot question campaign on charter school expansion. National Education Policy Center.
71. Jennifer Berkshire. “What Went Down in Massachusetts – Have You Heard.” Have You Heard. Web. 28 Apr. 2017.
72. Blum, L. What we can learn from the Massachusetts ballot question campaign on charter school expansion. National Education Policy Center.
73. Vaznis, James. “In Boston, Charter Vote Reflected Racial Divide – The Boston Globe.” BostonGlobe.com. 14 Nov. 2016. Web. 28 Apr. 2017.
74. Ibid.
75. Jennifer Berkshire. “What Went Down in Massachusetts – Have You Heard.” Have You Heard. Web. 28 Apr. 2017.
76. Vaznis, James. “In Boston, Charter Vote Reflected Racial Divide – The Boston Globe.” BostonGlobe.com. 14 Nov. 2016. Web. 28 Apr. 2017.
77. Ibid.
78. Ryan, D. L. (2016, October 18). On charter schools, a new partisan divide – The Boston Globe. Retrieved May 03, 2017.
79. “Massachusetts Authorization of Additional Charter Schools and Charter School Expansion, Question 2 (2016).” Ballotpedia. Web. 02 May 2017.
80. Mass. Democrats Vote To Oppose Charter School Question. (n.d.). Retrieved May 03, 2017.
81. Ibid.
82. Hefling, K. (2016, November 04). Democrats feud over charter schools in Massachusetts. Retrieved May 03, 2017.
83. Rocheleau, Matt. “A Town-by-town Look at Income in Massachusetts – The Boston Globe.” BostonGlobe.com. 18 Dec. 2015. Web. 03 May 2017.
84. “Massachusetts Question 2 – Expand Charter Schools – Results: Rejected.” The New York Times. The New York Times. Web. 03 May 2017.
85. Vaznis, James. “In Boston, Charter Vote Reflected Racial Divide – The Boston Globe.” BostonGlobe.com. 14 Nov. 2016. Web. 28 Apr. 2017.
86. Davis, J. (2016, November 10). Crushing defeat leaves charter-school movement in limbo – The Boston Globe.
87. Ibid.
88. Jennifer Berkshire. “What Went Down in Massachusetts – Have You Heard.” Have You Heard. Web. 28 Apr. 2017.
89. Blum, L. What we can learn from the Massachusetts ballot question campaign on charter school expansion. National Education Policy Center.
90. Education Victories Democrats Can Rally Around. (2016, November 10).
91. Good News on a Gloomy Night: Question 2 in Massachusetts Fails Overwhelmingly. (2016, November 09).
92. Jennifer Berkshire. “What Went Down in Massachusetts – Have You Heard.” Have You Heard. Web. 28 Apr. 2017.
93. Blum, L. What we can learn from the Massachusetts ballot question campaign on charter school expansion. National Education Policy Center.
Works Cited
Vaznis, J. (2016, November 14). In Boston, charter vote reflected racial divide – The Boston Globe. Retrieved April 28, 2017, from https://www.bostonglobe.com/metro/2016/11/13/boston-charter-vote-reflected-racial-divide/t5EI29okErZ7JDItnkPZKI/story.html
Blum, L. What we can learn from the Massachusetts ballot question campaign on charter school expansion. National Education Policy Center.
What Went Down in Massachusetts – Have You Heard. Retrieved April 28, 2017, from http://haveyouheardblog.com/what-went-down-in-massachusetts/
Cohodes, S., & Dynarski, S. M. (2017, March 29). Massachusetts charter cap holds back disadvantaged students | Brookings Institution. Retrieved April 28, 2017, from https://www.brookings.edu/research/massachusetts-charter-cap-holds-back-disadvantaged-students/
Cohodes, S., & Dynarski, S. M. (2017, March 29). Massachusetts charter cap holds back disadvantaged students | Brookings Institution. Retrieved May 03, 2017, from https://www.brookings.edu/research/massachusetts-charter-cap-holds-back-disadvantaged-students/
Crookston, P. (2016, November 07). Massachusetts Teachers Pressured by Union Leaders to Oppose Charter Schools. Retrieved April 28, 2017, from http://www.nationalreview.com/corner/441886/massachusetts-teachers-union-pressures-members-vote-against-charter-schools
Dark Money: Pro-Charter-School Fat Cats Took A Page From Offshore Gambling Tycoons. (n.d.). Retrieved April 28, 2017, from http://blogs.wgbh.org/masspoliticsprofs/2017/2/16/dark-money-pro-charter-school-fat-cats-took-page-offshore-gambling-tycoons/
Davis, J. (2016, November 10). Crushing defeat leaves charter-school movement in limbo – The Boston Globe. Retrieved May 03, 2017, from https://www.bostonglobe.com/metro/2016/11/09/crushing-defeat-leaves-charter-school-movement-limbo/Lj1JIwnZQIeTOD7sV6G5YL/story.html
Education Victories Democrats Can Rally Around. (2016, November 10). Retrieved April 28, 2017, from http://educationopportunitynetwork.org/education-victories-democrats-can-rally-around/
GOP Senate Leader from Suburbs Wants More Charters for New York City. (2017, April 24). Retrieved April 28, 2017, from https://dianeravitch.net/2017/04/24/gop-senate-leader-from-suburbs-wants-more-charters-for-new-york-city/
Good News on a Gloomy Night: Question 2 in Massachusetts Fails Overwhelmingly. (2016, November 09). Retrieved May 03, 2017, from https://dianeravitch.net/2016/11/09/good-news-on-a-gloomy-night-question-2-in-massachusetts-fails-overwhelmingly/
Hefling, K. (2016, November 04). Democrats feud over charter schools in Massachusetts. Retrieved May 03, 2017, from http://www.politico.com/story/2016/11/democrats-divided-on-mass-charter-school-expansion-230888
Mass. Democrats Vote To Oppose Charter School Question. (n.d.). Retrieved May 03, 2017, from http://www.wbur.org/edify/2016/08/17/mass-democrats-charter-school
Massachusetts Authorization of Additional Charter Schools and Charter School Expansion, Question 2 (2016). (n.d.). Retrieved May 02, 2017, from https://ballotpedia.org/Massachusetts_Authorization_of_Additional_Charter_Schools_and_Charter_School_Expansion,_Question_2_(2016)
Massachusetts Teachers Knock Out Corporate Charter School Scheme. (n.d.). Retrieved April 28, 2017, from http://www.labornotes.org/2016/11/massachusetts-teachers-knock-out-corporate-charter-school-scheme
“Massachusetts Question 2 – Expand Charter Schools – Results: Rejected.” The New York Times. The New York Times. Web. 03 May 2017.
Rinaldi, J. (2016, November 03). How many charter schools are too many? – The Boston Globe. Retrieved April 28, 2017, from https://www.bostonglobe.com/metro/2016/11/02/how-many-charter-schools-are-too-many/dU4TSVjIlfgNvnzHKj7M1I/story.html
Rocheleau, Matt. “A Town-by-town Look at Income in Massachusetts – The Boston Globe.” BostonGlobe.com. 18 Dec. 2015. Web. 03 May 2017.
Ryan, D. L. (2016, October 18). On charter schools, a new partisan divide – The Boston Globe. Retrieved May 03, 2017, from https://www.bostonglobe.com/metro/2016/10/18/charter-schools-new-partisan-divide/YQ3ZkMshShWkoVXZv4mR4N/story.html
Staff, G. (2016, November 02). Charter school vote may hurt credit ratings, Moody’s warns Boston, 3 other cities – The Boston Globe. Retrieved May 03, 2017, from https://www.bostonglobe.com/metro/2016/11/01/charter-school-vote-may-hurt-credit-ratings-moody-warns-boston-other-cities/bvEw1j0femPzR28M7mgTFN/story.html
Strauss, V. (2016, October 15). NAACP ratifies controversial resolution for a moratorium on charter schools. Retrieved April 28, 2017, from https://www.washingtonpost.com/news/answer-sheet/wp/2016/10/15/naacp-ratifies-controversial-resolution-for-a-moratorium-on-charter-schools/?utm_term=.b8d575604ecf
Why Question 2 grassroots opposition is growing. (2016, August 29). Retrieved April 28, 2017, from https://commonwealthmagazine.org/education/why-question-2-grassroots-opposition-is-growing/
Schoenberg, S. S. (2016, November 15). Moody’s: Vote against charter school expansion ‘credit positive’ for Massachusetts cities like Springfield. Retrieved April 28, 2017, from http://www.masslive.com/politics/index.ssf/2016/11/moodys_no_vote_on_charter_scho.html
Schoenberg, S. S. (2016, November 01). Teachers unions file complaint over ‘pay-to-play’ allegations involving charter school supporters. Retrieved May 03, 2017, from http://www.masslive.com/politics/index.ssf/2016/11/teachers_unions_file_complaint.html
Schoenberg, S. S. (2016, November 05). Who is funding Massachusetts Question 2, on charter school expansion? Retrieved April 28, 2017, from http://www.masslive.com/politics/index.ssf/2016/11/who_is_funding_massachusetts_question_2_charter_schools.html
Building Failure Factories: How Pinellas County is failing its Black Students
Introduction
In 2015, “Failure Factories,” a Tampa Bay Times exposé on the failure of hyper-segregated south county elementary schools called Pinellas County “the worst place to be black and attend public schools in Florida.”
After a 2007 decision by the school board to abandon integrative busing measures, five elementary schools in a small, historically black area of the southern part of the county quickly became five of the worst schools in Florida. Since 2015, the series “Failure Factories” won a Pulitzer Prize in local reporting, a new superintendent was hired, the federal government launched a civil rights investigation into the district’s practices, and black students in Pinellas are no better off.
Indeed, the effects of hyper-segregation soon bled into every facet of the school system, including disciplinary measures that increasingly began to affect black students at a widening, disproportionate rate (National Juvenile Justice Network 2015, and Florida Department of Juvenile Justice 2015).
Analysis of Pinellas County discipline records show that black students are more likely than their white peers to face in-school-suspension, out-of-school suspension, and school arrests (National Juvenile Justice Network 2015). I plan to argue that the racial disparities seen in disciplinary practices and the 2007 decision to end busing efforts have contributed to the racial achievement gap in Pinellas County Schools.
I will then analyze data from the eighth worst performing school in Florida, Campbell Park Elementary, tracking changes to academic performance following resegregation. Although I will not attempt to prove causality, the unique plight of south county schools cannot be explained by factors like poverty as these schools are performing worse than schools in districts with fewer resources (Bureau of Economic Analysis 2006).
Finally, I will consider literature that suggests these factors are disproportionately harming black students in Pinellas. Other reports have studied the achievement gap and disciplinary disparities in Pinellas County but none have discussed the intersection of these as a direct result of the 2007 to stop integrative busing.
Background
As is common across the nation, Pinellas County Schools has struggled to integrate schools since Brown v. Board due in large part to the unequal demographic makeup of the district neighborhoods (Rothstein 2014). School enrollment data shows that 55.9% of students are white, 18.6% are black, and 16.4% percent are Hispanic (Pinellas County Schools 2016). However, black students in Pinellas are concentrated in the southern part of the county so much so that 85% of African American families live within a 12-square-mile section in St. Petersburg, the fourth largest city in the state of Florida (Fitzpatrick, Gartner, & LaForgia 2015, DeBray 2007). Julie Janssen (2001) describes the unique demographic pattern:
This school district has specific and unique geographical politics, stemming in part from the division of the County into north and south by Ulmerton Road. The racial composition of students in the two geographic regions are notably dissimilar with the majority of black students living in the southern part of the district and only small “pockets” of black students living north of the dividing line, Ulmerton Road. (p. 13)
This pattern is longstanding and the racial makeup of the district looked similar in 1971, when the court decision Swann v. Charlotte-Mecklenburg (1971) forced the school district to implement busing to integrate the county (DeBray 2007). This court ordered busing was for all intents and purposes effective. In 1976, only 3.8% of black students went to majority African American schools whereas 54.5% of black students had gone the majority African-American schools in 1970, prior to the Swann decision (DeBray 2007).
The 1971 court order also laid out enrollment limits that stated no school would exceed 30% African American students (later changed to 42% for the 2003-2004 school year) (DeBray 2007).
Yet this 1971 plan to begin busing in Pinellas County was implemented in such a way that the predominantly white residents in the northern part of the county were excluded from the orders. And so, black students south of the Ulmerton road divide were bused outside of their neighborhood to achieve racial diversity (DeBray 2007).
Understandably, black residents spoke out against this inequity and in 1998 the plan for school choice was revisited. Families across the county and the local National Association for the Advancement of Colored People chapter met with the School Board, which then voted to ask the U.S District Court for a unitary designation for the county, essentially freeing the district from the court order laid out in Swann. This was done in hopes of developing a method for voluntary choice that would put a stop to the unfair treatment of families in the south county neighborhoods (DeBray 2007).
The district court ruled in favor of the unitary distinction, allowing the county to develop a method of choice integration so long that it complied with the previous limits of racial makeup for individual schools. Choice “zones” were created and so long as families made choices that adhered to the racial makeup limitations, their choices were granted. Additionally, students in north county were no longer exempt and thus busing became more equitable across the county (DeBray 2007).
In 2007, the Parents Involved vs. Seattle School District Supreme Court case ruled that schools could no longer control enrollment by race. This decision meant the end of the practice of obligatory racial proportions that Pinellas County and other districts across the national had been using to balance diversity within the county. So, in 2007 the Pinellas County School Board voted to end integrative busing. Families across the country rejoiced that their children would no longer have to commute 30-45 minutes to a school outside of their residential neighborhood. But black community members were not as pleased and voiced concerns that the predominantly black neighborhoods in southern county would suffer for these changes. The district ensured that the quality of the schools would not falter, promising extra funding and resources that never came (Tampa Bay Times Staff 2007, and Fitzpatrick, Gartner, and Laforgia 2015).
Thus, the hypersegregation of Pinellas County began.
 Figure 1: This shows the proportion of black students in Pinellas County schools prior to and post 2007. The map in the top right corner displays Pinellas County, showing that the mostly black schools are heavily concentrated in the southernmost part of the district.
Academic Failure after Resegregation
The decision to end busing turned out to be a disastrous one for black families in Pinellas County. Resources were not funneled to schools in historically black neighborhood schools as was promised. Instead, the district used shady tactics to attempt to shortchange south county schools from their district funding, counting money received from the federal Title I allotment towards their district budget total (Fitzbatrick, Garter, and Laforgia 2015).
It didn’t take long for the effects of implementation to negatively impact school performance. The state of Florida uses a grade-based accountability system to evaluate each of its schools at the end of the academic year. Schools are measured by metrics including performance on state standardized tests but also learning gains for all students and for the lowest performing 25% of students. Academic outcomes in Pinellas County took a dive across the district after 2007. The charts below show the number of Pinellas County Schools that received an “A” on Florida’s annual school grading system and the number that received an “F”.
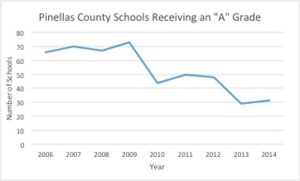
Figure 2: The number of schools receiving an A grade on the annual accountability report dropped after 2007.
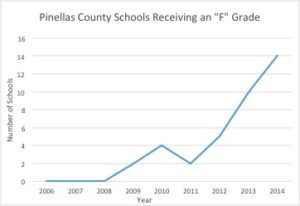
Figure 3: The number of schools receiving an F grade on the annual accountability report rose from 0 schools to 14 schools in just six years.
Source: Florida Department of Education. School Accountability Reports 2006-2014.
Academic Inequality
Even though Pinellas County showed a decline across all schools’ performance after 2007, it was the south county schools that felt the brunt of the impact. Without the resources that the white, north county students brought to the south county schools, the schools quickly became some of the worst in Florida (Fitzpatrick, Gartner, LaForgia 2015).
And since the southern county schools are predominantly black, a pronounced black-white racial achievement gap emerged in Pinellas County. Testing results from Florida standardized tests administered to all student in the 2015-2016 school year are shown below.
Figure 4
Pinellas County boasts an achievement gap between their black and white students that is markedly higher than state averages in both English Language Arts and Mathematics

Figure 4.1: The achievement gap in Pinellas County (right) as compared to state averages (left) in English Language Arts. Florida Department of Education. 2015-2016
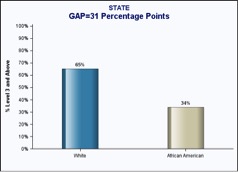
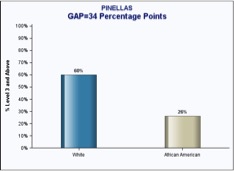
Figure 4.2: The achievement gap in Pinellas County (right) as compared to state averages (left) in Math. Florida Department of Education. 2015-2016
A Case Study
In 2007, prior to resegregation in Pinellas, Campbell Park Elementary was a “B” school with a school population of 32.8% white students and 47.8%. By 2015, Campbell Park had become segregated with a population made up of 13.6% white students and 79.9% black students. It was consistently receiving an “F” grade on its annual accountability report (Florida Department of Education).
Here, I track Campbell Park’s decline from an average elementary school to one of the worst in the state. This decline took place in the years following the 2007 decision to abandon busing. The school quickly became hyper-segregated, lost teachers, saw an unprecedented increase in violent incidents and exclusionary discipline practices (Fitzpatrick, Gartner, and LaForgia 2015).
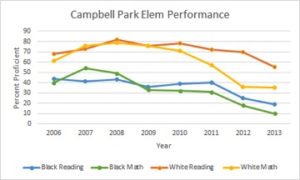
Figure 5: While academic achievement suffered across the board at Campbell park, the black-white achievement gap perisisted, with only 20% and 10% of black students being proficient in reading and math respectively in 2013.
While each of the aforementioned factors can independently cause students at a school to suffer losses in academic performance, the decline at Campbell Park Elementary was unparalleled by any other school in Florida. In fact, schools in communities with the same racial and socioeconomic makeup were not performing as badly as Campbell Park (Fitzpatrick, Gartner, and LaForgia 2015).
Discipline in Pinellas County
On the Pinellas County School Board website, it states that “In all instances, school discipline should be reasonable, timely, fair, age-appropriate, and should match the severity of the student’s misbehavior.” And for some students, this might hold true. However, investigation into county discipline records shows that black students are disproportionately on the receiving end of disciplinary practices, and to a greater degree than their white peers.
Compared to the State
Pinellas County boasts an unusually high number of suspensions. In fact, Pinellas County employs suspension as punishment more often than 70% of the other counties in Florida (National Juvenile Justice Network 2015).
Similarly, Pinellas has a high rate of school arrests, recording a higher number of school arrests for 2015 than 81% of counties in Florida (National Juvenile Justice Network 2015).
Racial Disparities
While these numbers alone should be enough to make Pinellas officials pay attention to the district’s disciplinary problems, the underlying racial disparities taking place in all facets of school discipline are even more concerning.
- 54% of black students received an in-school suspension compared to 20% of their white peers
- Pinellas is 3rd in the state for disproportionately arresting black students
While 20% of the students in Pinellas County are black, black students are overrepresented in the number of school arrests, out-of school suspensions, number of students labeled “Emotionally/Behaviorally Disabled”, number of students held back a grade, and the number of students sent to an alternative school. Black Pinellas students are underrepresented in gifted classrooms. Moreover, only 8% of Pinellas County teachers are black, 12 points below the proportion of black students and nearly half the state average (National Juvenile Justice Network 2015).
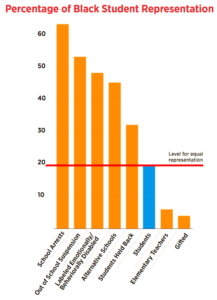
Figure 6: Black students are overrepresented in discipline numbers and special needs classrooms and underrepresented in the teaching force and gifted classrooms.
Furthermore, black students in Pinellas represent 68% of the students arrested for school related incidents.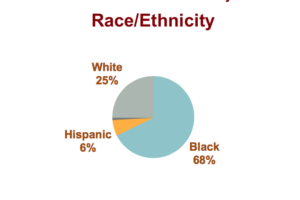
Figure 7: Even though black students comprise less than 20% of students enrolled in Pinellas County schools, they make up almost 70% of school arrests.
And despite a downward 5-year trend of school arrests in Pinellas County, the county’s Relative Rate Index, a measure used to compare arrests of black juveniles versus white juveniles has been steadily increasing since 2010 (Florida Department of Juvenile Justice 2015).
Information gathered in the Florida Department of Juvenile Justice Disproportionate Minority Contact Benchmark report for the FY 2014-2015 measures the occurrences of juvenile interaction with the juvenile justice system. A Relative Rate Index score of 1.0 indicates that the rate of occurrence for white juveniles is the same as the rate of occurrence for minority juveniles. An RRI score greater than 1 indicates that the rate of occurrence is higher for minority juveniles than white juveniles, and vice versa for a RRI score less than 1.
Pinellas County has an RRI score of 6.2, making it the 4th highest in the state.
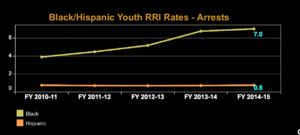 Figure 8: The growing Relative Rate Index shows that racial disparities in school arrests and the juvenile justice system are increasing.
Explanations
While I cannot definitively say that either the disparities in discipline practices nor the 2007 decision to end busing directly caused the lower academic performance in Pinellas County and the southern county schools specifically, national studies point to the conclusions that these phenomena negatively affect student performance.
Time spent engaged in academic learning and student performance have consistent positive correlations (Greenwood, Horton, & Utley 2002). The National Juvenile Justice Network found in 2015 that black students in Pinellas County had lost a combined 250,000 school days to out-of-school suspension.
In 2010, three researchers (Gregory, Skiba, and Noguera) studied the correlation of racial disparities in achievement and discipline and found that “Suspended students may become less bonded to school, less invested in school rules and course work, and subsequently, less motivated to achieve academic success.”
In 2016, a study concluded that 1/5 of black-white differences in school performance can be attributed to school suspensions (Perry & Morris 2016). Furthermore, the common narrative in support for the use of suspension holds that removing the disruptive students is necessary for the obedient students to succeed. However, exclusionary discipline measures (like out-of-school suspension and arrests) have been shown to hurt not only the disciplined students but even the non-suspended students (Perry & Morris, 2014). In their 2014 study, Perry and Morris discovered that when school’s suspended large numbers of student it has indirect adverse effects on the non-suspended students by creating a punitive environment within the school.
Seeing that Pinellas tops the list of districts in Florida for its use of suspension, the academic failure of its schools (and specifically its black students) should not come as any surprise. Indeed, while these phenomena hold true regardless of race, Pinellas’ disproportionate use of exclusionary discipline measures on black students undoubtedly contributes to the double-digit achievement gap.
Likewise, studies have shown that integrated schools can narrow the black-white achievement gap (Rothstein 2014). And like discipline reforms, focusing on integration benefits not only low-income, minority students like those in southern Pinellas County, but all students. In their report on the benefits of diversity in K-12 schools, Amy Stuart Wells, Lauren Fox, and Diana Cordova-Cobo find the following:
Researchers have documented that students’ exposure to other student who are different from themselves and the novel ideas and challenges that such exposure brings leads to improved cognitive skills, including critical thinking and problem solving.”
Recommendations
Pinellas County failed its black students in 2007 by voting to end integrative busing. But it continues to fail them every day by keeping policies in place that disproportionately hurt black students.
In order to move toward a more equitable system, Pinellas must abandon its use of exclusionary discipline practices. By implementing more specific guidelines for administrators to use before punishing a student, schools can work to bring down the number of suspensions, thereby creating a more positive school environment for all. Additionally, anti-bias training for teachers ought to be implemented as a way to decrease the disparity between black and white disciplinary actions (National Juvenile Justice Network 2015).
School Resource Officers should be likewise trained in anti-bias protocol and additionally in de-escalation techniques. When students are taken out of school for non-violent offenses, no one wins.
To address the stark achievement gap between black and white students and north and south county schools, there exists a few options.
- The county could reinstitute busing
This seems like an unpopular solution based on the public support for the end of busing and without a plan in place to avoid settin racial quotas, the county could inadvertently place itself in violation of the Parents Involved Supreme Court Decision.
- Students could be sorted by economic diversity
Studies have shown that creating economic diversity in schools allows student to receive some of the same benefits that going to a racially diverse school would give them (Schwartz 2009). Additionally, this method of integration is compliant with the Parents Involved ruling.
- Rework the allocation method for county funds
This could work to give south county schools the resources they need in the absence of wealthy community members. Metrics would need to take into account the wealth of the surrounding community. This policy would be difficult to implement within a county because taxpayers who are able move to more expensive neighborhoods to go to higher-achieving schools.
- An expansion of the county’s magnet and fundamental school programs
While this method has done a successful job in the past of creating more integrated schools, it raises the concern that although demographically the schools are desegregated, the school community is not as students exist in racially homogenous pockets.
Conclusion
Until the school board and community leaders can agree on a plan that institutes some combination of these proposals in Pinellas County Schools, the hyper-segregation that has plagued the district will continue to grow alongside the black-white achievement gap. It is no coincidence that these schools became failure factories once the county turned a blind eye to the importance of racial integration. If separate but equal didn’t work in 1954, it surely isn’t working for black children in 2017 Pinellas County.
References
Adams, Jane Meredith. 2015. “Study: Suspensions harm ‘well- behaved’ kids” EdSource. January 8. Accessed April 30th, 2017.
Bureau of Economic Analysis. 2006. Per Capita Personal Income – Florida Counties, Florida and the U.S
Delbray-Pelot, Elizabeth H.. 2007. “NCLB’s Transfer Policy and Court-Ordered Desegregation.” Educational Policy. Vol 21, Issue 5, pp. 717-746.
Fitzpatrick, Cara, Gartner, Lisa, and LaForgia, Michael. 2015. “Failure Factories,” Tampa Bay Times, August 14.
Florida Department of Education. 2015. Closing the Achievement GAP. Interactive Report.
Florida Department of Education. 2006. School Accountability Reports.
Florida Department of Education. 2007. School Accountability Reports.
Florida Department of Education. 2008. School Accountability Reports.
Florida Department of Education. 2009. School Accountability Reports.
Florida Department of Education. 2010. School Accountability Reports.
Florida Department of Education. 2011. School Accountability Reports.3
Florida Department of Education. 2012. School Accountability Reports.
Florida Department of Education. 2013. School Accountability Reports.
Florida Department of Education. 2014. School Accountability Reports.
Florida Department of Juvenile Justice. 2015. Delinquencies in Schools 2013-2014.
Florida Department of Juvenile Justive. 2014. Racial and Ethnic Disparities Benchmark Report 2012-2013.
Gregory, Anne, Skiba, Russell, & Noguera, Pedro. 2010. “The Achievement Gap and the Discipline Gap: Two Sides of the Same Coin?” Educational Researcher, Vol 39, Issue 1, pp. 59-68.
Janssen, J. (2001). An analysis of the legal and historical context of the Pinellas County School District’s separation from court-ordered desegregation established in Bradley v. Board of Public Instruction. Unpublished doctoral dissertation, University of South Florida.
Morris, Edward W., and Perry, Brea L. 2016. “The Punishment Gap: School Suspension and Racial Disparities in Achievement.” Social Problems. Vol 3, Issue 1, pp. 68-86.
National Juvenile Justice Network. 2015. Pinellas County Schools Report Card.
Perry, Brea L., and Morris, Edward W. 2014. “Suspending Progress: Collateral Consequences of Exclusionary Punishment in Public Schools.” American Sociological Review. Vol 79, Issue 6, pp. 1067-1087.
Pinellas County Schools. 2017. Facts-at-a-Glance. Accessed May 3, 2017. https://www.pcsb.org/Page/650
Pinellas County Schools Office of Assessment, Accountability and Research. 2015. Discipline Disparity.
Rothstein, Richard. 2014. “The Racial Achievement Gap, Segregated Schools, and Segregated Neighborhoods – A Constitutional Insult.” Economic Policy Institute. Vol 6 Issue 4
Schwartz, Heather. 2009. “Do poor children benefit academically from economic integration in schools and neighborhoods? evidence from an affluent suburb’s affordable housing lotteries” PhD dissertation, Department of Philosophy, Columbia University, New York City.
Wells, Amy Stuart, Fox, Lauren, and Gordova-Cobo, Diana. 2016. “How Racially Diverse Schools and Classrooms can Benefit All Students.” The Century Foundation.
Is the Harlem children’s zone accomplishing its goal? Should HUD’s promise zone initiative be the future of American public education?
Background
Schools in poor and low-income neighborhoods have often lack access to adequate educational resources and social services and may be ill equipped to provide interventions to the trauma associated with poverty. Under the Obama administration, The Department of Housing and Urban Development passed the “promise zone” initiative to improve educational outcomes for students in distressed urban and rural neighborhoods by connecting schools with local businesses and community organizers. The Harlem Children’s Zone (HCZ), part of the impetus for the project, is a privately funded non-profit organization for poverty-stricken children and families living in Harlem, New York. It is a community-based project that provides free support to those in need with the goal of ending generational poverty. The zone, which includes parental workshops, a preschool program, charter schools, and child-oriented health programs for thousands of children and families, has stood out as the success story of effective social capital and communal cohesion. The model of HCZ poses the question of whether neighborhood zones represent a paradigm shift in modern American education and if HUD’s promise zone initiative is a sound solution to end intergenerational poverty.
The Harlem Children’s Zone (HCZ) is a non-profit organization for families in poverty living in Harlem, New York that provides free social, educational, and healthcare support. The HCZ is “aimed at doing nothing less than breaking the cycle of generational poverty for the thousands of children and families it serves.”[1] The organization began as the Rheedlen Centers for Children and Families as New York City’s first truancy prevention program in 1970. By 1994, Rheedlen opened a Beacon center – Countee Cullen Community Center – at Public School (P.S.) 194 – for after school, weekend, and summer programming. In 2000, HCZ started “The Baby College,” a series of parenting workshops. In 2001, it introduced the “Harlem Gems” pre-school program and by 2004, it opened Promise Academy, the zone’s first charter school. Now, the project has expanded to about 100 blocks of Central Harlem and includes 3 extended-day charter schools, all-day pre-kindergarten, health clinics and community centers for adults and children, youth violence prevention programs, foster care social services, and college admissions and retention support.[2] Living up to its moniker of “cradle-to-college,” HCZ reported 96% college acceptance rate in 2016. Spurred by the success of the zone, Former President Obama launched the promise zone initiative in 2013.
In contrast the privately funded non-profit HCZ, promise zones are high poverty urban, rural and tribal communities designated by the United States Department of Housing and Urban Development (H.U.D) to connect and partner with local leaders and receive federal funding aimed at “improving educational opportunities, leveraging private investment, increasing economic activity, reducing violent crimes, enhancing public health and addressing other communal priorities.”[3] Promise zone designees receive a federal liaison to help navigate federal programs, preferences for certain competitive federal grant programs and technical assistance to manage and facilitate initiatives. The federal model attempts to replicate HCZ by encouraging community based public and partnerships between schools and educators and local businesses and corporations. For example, designees also receive tax incentives, and an opportunity to engage five AmeriCorps VISTA members. On January 9th, 2014 Los Angeles, Philadelphia, and San Antonio were announced as the first round promise zone designees. On April 28th, 2015, Camden; Indianapolis; Minneapolis; North Hartford; Sacramento; and St. Louis were announced as the second round designees. Finally, on June 6th, 2016, Atlanta; Nashville; Evansville; South Los Angeles; San Diego; Spokane Tribe of Indians, Washington; Turtle Mountain Band of Chippewa Indians, Rolette County; and Roosevelt Roads, Puerto Rico were announced as the third and final round of designations bringing the total to 22 Promise Zones across the country.
Question – Is the Harlem children’s zone accomplishing its goal? Should HUD’s promise zone initiative be the future of American public education?
In recent years, there has been much controversy surrounding the Harlem Children’s Zone as a model for the future of education. The 2010 documentary Waiting for “Superman” praised the model and promoted HCZ as a model of education of which to aspire.[4] The documentary criticizes the American public education system most specifically teacher tenure, teaching standards and teacher unions and makes statistical comparisons between state, private, and charter schools. The film also stars Geoffrey Canada, who is the founder and CEO of the HCZ. A year later, the Grassroots Education Movement released the film The Inconvenient Truth Behind Waiting for Superman accusing the former of exaggerating the success of the HCZ and bringing into light the high private revenues of the zone of which public schools cannot compete.[5] To date, HCZ has an endowment of $175 million and revenue of $75 million. Stanley Druckemiller, a former hedge fund manager and college friend of Canada, who has given over $100 million since 2006, donate most of the funds.[6] In comparison, each federally designated promise zone receives about a quarter, if that, of HCZ’s endowment over multiple years.
Comparing financial support, HCZ falls into the 10% of New York school districts. The zone spends about $16,000 per student per year at the Promise Academies and an average of $5,000 per child for the many other programs the HCZ provides outside the charter schools.[7] Slightly lower, New York City spends $14,452 per student per year. (IBID) However, HCZ does not have the highest spending per capita among school districts. The richest 10 percent of New York school districts spend $28,754 per student, much higher than the cost of educating students in the Harlem Children’s Zone and three times the national average.[8] While HCZ comes with a steep price tag, the data on district spending begs the question of what price is equitable to close the gap between the poorest and the wealthiest?
Financial differences aside, longitudinal statistic research uses HCZ as a basis to question whether neighborhood based approaches to educational achievement of low-income students work any better than conventional methods. In a study of the HCZ, Brookings posed two related but strikingly different questions about the efficacy of the zone: first, do students “who receive the full panoply of HCZ services have superior achievement to similar students who don’t receive those services” and second, did “students who received the schools-only component of the HCZ” perform as well as “students who received the full treatment?”[9] The research presumes that if HCZ works, then it must prove that students who receive all of the services and neighborhood interventions have higher achievement than similar students, even those partially involved in the zone and especially those not involved in the zone at all. The report references an experiment conducted by Harvard researchers Will Dobbie and Roland G. Fryer published in 2009 that compared the educational achievement of students that attended the HCZ’s oldest charter, Promise Academy, with the students who did not. Dobbie and Fryer, concluded that “the effects in middle school are enough to reverse the black-white achievement gap in mathematics” however “students outside the Zone garner the same benefit from the HCZ charter schools as the students outside the Zone.”[10] In summary, proximity didn’t show a statistically significant difference such that high-quality schools and high-quality schools coupled with community investments generate the same achievement gains.
Now, the Brookings report was limited in scope by relying on a group of students selected to participate in a lottery to attend an HCZ charter school, leaving numerous unanswered variables. When slots exceed supply, NYC charters are required to take students by lottery. Dobbie and Fryer theorized that by studying these “lottery winners” and “lottery losers” they could essentially create the conditions for a randomized experiment; however, the outcomes of these students cannot be solely held to the respective schools for a conclusive answer to the question. First, there is no assessment of various demographics – the educational background, socioeconomic status, race, disabilities, etc. – of these students prior to lottery assignments. Second, this study doesn’t measure how the zone impacts and reweaves the social fabric of Harlem, a community that has been degenerated by poverty for over a century. To reiterate, the purpose of the zone is to end intergenerational poverty and is thus aimed at various social enterprises, not just education. The results of the charter schools are merely one aspect of the Harlem community and do not present a robust analysis of the whole community impact.
Standardized test scores reveal that HCZ does not stand out among some of New York City’s charter schools. The HCZ Promise Academy I is the longest established HCZ public charter and serves elementary through high school. Comparing results from Promise Academy to the average test scores of all charters in Manhattan and the Bronx, Brookings found that “half or more of the public charter schools in Manhattan and the Bronx produce test scores on state assessments that are superior to those produced by the HCZ Promise Academy,” which is true both for actual scores and scores adjusted for student demographics (percent free lunch, percent reduced lunch, percent limited English proficient, percent African American, and percent Hispanic).[11] Although HCZ appeared to perform slightly stronger in the mathematics exam, in conclusion, HCZ Promise Academy “is a middling New York City charter school.”
However to date, HCZ schools have impacted students of the Harlem community. By 2013, although no class had yet graduated from the complete cradle to college pipeline (Baby College through Promise Academy), over 900 students had been enrolled in HCZ’s College Success Office.[12] In addition, the majority of these students were in their first to third years of post-secondary schooling and 36 had graduated from two-year and four-year degree programs. Less than 10% of HCZ students had dropped out of school, which is significantly lower the national average of 43.6%. The state of New York requires high schoolers to earn a 65 on the standardized Regents exam to earn a diploma. In 2010, and 2012, Promise Academy I scored comparatively with the most competitive of NYC charter schools. “Promise Academy I’s entire 2012 graduating class scored 65 or higher (with almost half scored 85 or higher) on the English exam; 90 percent scored 65 or higher on the Geometry exam; and 96 percent scored 65 or higher on the Algebra 2 and Trigonometry exam. In 2010, 92 percent scored a 65 or higher on the Integrated Algebra exam.”[13] Finally, in the New York City Progress Report for 2011–2012, Promise Academy I placed in the 99th percentile of city high schools with the sixth-highest score in the city, boasting a 96 percent pass rate in English and 98 percent pass rate in Integrated Algebra in the New York Regents examination.
Moreover, Dobbie and Fryer do note that HCZ does make a difference. “They concluded that the Promise Academy and additional support services had effectively reversed ‘the black–white achievement gap in mathematics (HCZ students outperform the typical white student in New York City and the difference is statistically significant) and reduced it in ELA [English Language Arts].”[14] Especially at the younger levels, the researchers found statistically significant differences for Harlem students who attended and didn’t attend Promise Academy. “The effect of being enrolled at the elementary charter school on third-grade test scores—the first year that children in New York take standardized exams—is large and precisely estimated, with point estimates ranging from 1.906 to 2.039 standard deviations in math and 1.693 to 1.863 in ELA. This suggests that the HCZ elementary school impacts both math and ELA scores significantly, eliminating the race gap in both subjects.”[15] Of course, the same limitations apply for the positive and negative results of the Dobbie and Fryer study. It was based on the lottery of a single of class students in a single year, which may not reflect the performance of HCZ relative to other schools in previous school years.
Continuing, equating academic achievement with standardized test scores may only answer one piece of the puzzle. Canada responded to the formerly mentioned Brookings study and criticized its “wrong-headed take” on the Zone.[16] Mainly, he implied the failures of the study stem from its narrow analysis, which is of only one of the three charters and the lack of a longitudinal track of student growth over time. Citing the Dobbie and Fryer analysis and the Whitehurst and Croft analysis, Canada claims the latter ignores the charter schools that are outperforming Bronx and Manhattan schools and fails to include student growth at HCZ which also outperforms the boroughs.
Is it fact that HCZ Promise Academies perform on par with the upper echelon of New York City charters an indictment of its efficacy? Secondly, if yes, is that an indictment of the model as a whole? First, the Brookings report doesn’t compare HCZ charter to charters nationally or in other urban areas. It is important to consider to whom is the Zone being weighed. Second, there is inconclusive and controversial data on the ability of charters to promote educational achievement at the fundamental level due to selection and attribution biases.[17] Finally, what does ending intergenerational poverty mean and is it statistically reasonable to measure a charter that serves students in poverty to ones that may not. HCZ has a high price tag but so do some of the highest performing school districts and so, should they be targeted as well?
HCZ Promise Academy students do perform better than students of their backgrounds attending a New York City public school but the charter school at the top of the list is a KIPP school[18] which calls into comparison two different models of education and their abilities to create achievement for historically marginalized groups. Additionally, KIPP schools tend to more closely align their spending per-student to that of the surrounding district. On the other hand, the KIPP model has been around much longer and it can be argued that it may take time for HCZ to demonstrate the same level of achievement as much more established schools. But the question of how much time is enough time is a difficult one to answer.
Reforming neighborhoods and making schools the center of social service networks is certainly innovative but the data seems to be inconclusive on whether it will always work. While HCZ benefits from over $100 million in philanthropy to support its holistic approach and has seen wonderful successes, how replicable of a model is it? Can the HCZ model work in any neighborhood and its associated social services? What kinds of ingredients are required for the successful implementation of a school centered neighborhood zone? In conclusion, there doesn’t seem to be enough data to conclusively argue whether the HCZ neighborhood package “works.” Although there are noteworthy successes, it is difficult to unequivocally associate these results to HCZ exclusively.
There is quantitative data that is convenient for measuring the success of the Harlem Children’s Zone but the data is mixed and leaves many questions unanswered often telling oppositional narratives. We have only a limited basis for evaluating the Zone’s full impact. To reiterate, the Zone “works to reweave the social fabric of Harlem” and so to evaluate the Zone fully, the cumulative social impact of the organization on the entire Harlem community, not just specific results of the Zone schools ought to be measured. While academic success is an important factor in rebuilding a community, it is just one piece in the overall puzzle, not the puzzle itself. It is likely fair to say that HUD’s promise zone initiative will not be able to replicate the Harlem Children’s Zone and too soon to predict whether promise zones as opposed to schools-only approaches are better.
[1] “About HCZ – Helping Kids Succeed.” Harlem Children’s Zone. HCZ, n.d. Web. 03 May 2017.
[2] Ibid…
[3] “Promise Zones.” HUD. U.S. Department of Housing and Urban Development, n.d. Web. 03 May 2017.
[4] Heilemann Published Sep 6, 2010, John. “Schools: The Disaster Movie.” NYMag.com. New York Magazine, 6 Sept. 2010. Web. 03 May 2017.
[5] Szhamilton. “Waiting for Batman: Following the Money at the Harlem Children’s Zone.” Daily Kos. Daily Kos, 13 July 2011. Web. 03 May 2017.
[6] Callahan, David. “Who’s the Harlem Children’s Zone $100 Million Donor?” Inside Philanthropy. Inside Philanthropy, 22 Jan. 2014. Web. 03 May 2017.
[7] Otterman, Sharon. “Lauded Harlem Schools Have Their Own Problems.” The New York Times. The New York Times, 12 Oct. 2010. Web. 03 May 2017.
[8] Kellermann, Carol. “No More Aid for the Affluent.” The New York Times. The New York Times, 27 Mar. 2010. Web. 03 May 2017.
[9] Whitehurst, Grover, and Michelle Croft. “The Harlem Children’s Zone, Promise Neighborhoods, and the Broader, Bolder Approach to Education | Brookings Institution.”Brookings. Brookings, 28 July 2016. Web. 03 May 2017.
[10] Ibid…
[11] Whitehurst, Grover, and Michelle Croft. “The Harlem Children’s Zone, Promise Neighborhoods, and the Broader, Bolder Approach to Education | Brookings Institution.”Brookings. Brookings, 28 July 2016. Web. 03 May 2017.
[12] Hanson, Danielle. “Assessing the Harlem Children’s Zone.” The Heritage Foundation. The Heritage Foundation, 6 Mar. 2013. Web. 04 May 2017.
[13] Ibid..
[14] Hanson, Danielle. “Assessing the Harlem Children’s Zone.” The Heritage Foundation. The Heritage Foundation, 6 Mar. 2013. Web. 04 May 2017.
[15] Ibid..
[16] Swaminathan, Nikhil. “Geoffrey Canada Responds to Brookings Study on Harlem Children’s Zone.” GOOD Magazine. GOOD, 17 Feb. 2015. Web. 04 May 2017.
[17] Welner, Kevin G. “The Dirty Dozen: How Charter Schools Influence Student Enrollment.”National Education Policy Center. N.p., 10 May 2013. Web. 04 May 2017.
[18] “CHARTER SCHOOL PERFORMANCE IN NEW YORK CITY.” (n.d.): n. pag. Center for Research on Educational Outcomes. Stanford University, Jan. 2010. Web. 4 May 2017.
Mentor for America: Exploring Unified Best Practices in After-School Mentoring Programs
Mentor for America: Exploring Unified Best Practices in After-School Mentoring Programs
Hannah Alexander and Laura Londoño
Abstract
The United States experiences a strong culture of mentorship programs for all ages. Schools, churches, community centers, service groups, and universities set up opportunities for young people to engage with older, more experienced mentors that guide them through a wide range of life decisions and areas of personal growth. These mentoring relationships vary in core purpose, format, setting, frequency of meetings, and overall scope. Given the diverse nature of mentoring programs in the United States, this report explores the value and scalability of a specific mentoring model in which college students are paired with local middle school students in a three year program.

Introduction
The Jones-Zimmerman Academic Mentoring Program, hereafter referred to as JZAMP, is a three year academic mentoring program that pairs college students at urban universities with local middle school students at risk of dropping out. This free after school program creates an environment in which local middle schoolers can further their academic and life skills while developing a close relationship with a college student wholly invested in their success. Our experience with JZAMP’s successes in building on the motivation of students who have committed to the program, combatting the trend toward low performance in math and reading, have inspired us to explore the expansion and scalability of this model currently concentrated in three Connecticut based universities and their four corresponding middle schools.
In this report, we will couple our understanding and experience with the structure of the Jones Zimmerman Academic Mentoring Program with the Teach For America model. We will explore how TFA’s recruiting, training, and impact model can be applied in standardizing and scaling up three-year college mentoring programs throughout the United States.
Teach for America has a streamlined recruiting, placement, and training structure for its corps members. It provides on-campus recruiting at universities, encouraging college juniors and seniors of all academic backgrounds and interests to consider teaching. Beyond recruiting, Teach for America bridges the gap between new teachers and their placement schools through placement relationships and matching. This reduces the barrier between new teachers, and schools seeking to recruit new teachers, in working with one another. TFA additionally guides new teachers through training, certification, and preparation for their first day of teaching.
The aforementioned model allows Teach for America to place over 3,300 new corps members in schools throughout the country each year, providing them with a “skeleton” of tools they need to make a successful transition from college to the world of teaching. (TFA, 2017) Though different in nature, purpose, commitment level, and scope, this report will explore the ways in which TFA’s scaling model can be used to implement the J-Z AMP model throughout the country. More specifically, it will consider how a standardized method for recruiting and training college mentors for a three-year mentoring commitment can curb trends of low-impact programs throughout the country, changing the culture of mentorship altogether.
Background
Mentoring Programs
Academic research pertaining to mentoring programs shows mixed results. In a meta-analytic review conducted by a group at the University of Missouri, it was determined that there was “evidence of only a modest or small benefit of program participation for the average youth.” (Allen et al., 2008) However, the data demonstrated that, “program effects are enhanced significantly, however, when greater numbers of both theory-based and empirically based ‘best practices’ are utilized and when strong relationships are formed between mentors and youth.” (Allen et al., 2008)
This data demonstrates an imminent need to disseminate, employ, and enforce these “theory-based and empirically based ‘best practices.” Perhaps more importantly, it alludes to “practices” that do not work, and a responsibility to ensure that they are not universally employed. Given the wide scope of mentoring programs in the United States, however, bad practices are both ubiquitous and diverse in nature. We now will briefly explore what some of these practices look like.
Models That Do and Don’t Work
In the study conducted by a group at the University of Missouri, it was determined that “best
practices coincided with “multifaceted intervention program[s]” where “mentoring is linked to other supportive services.” (More specifically, they are usually installed to promote “positive youth development” and/or “instrumental goals relating to areas such as education or employment.” (Allen et al., 2008) Thus, it has been determined that the general philosophy with which mentoring programs are founded and approached is relevant in determining its success rate.
In analyzing these philosophies, it is also relevant to explore philosophies as such that have led to failing programs. In an analysis of the educational impact of a mentoring program at Wesleyan University, several of these less effective program philosophies were exhumed. In their mission, the NEAT program states that, “The North End Action Team (NEAT) is a community-based organization whose mission is to empower residents and stakeholders to participate in and advocate for the interests of the North End neighborhood within Middletown, Connecticut.” (NEAT, 2017) This program’s philosophy does not fall under the two aforementioned categories that the University of Missouri qualified as “effective,” and thus might explain the reasons why its mentors felt dissatisfied in its effectiveness.
Beyond the content of the program and the services provided to the individuals involved, the structure and methods by which the program and its services are provided fall into the aforementioned “practices.” Among them, the methods by which mentors and mentees are recruited, the timing and frequency of mentoring sessions, the setting in which mentoring takes place, and the time allocation within mentoring sessions are relevant.
Assessing Effectiveness
Though these factors can be objectively observed and disentangled, the capacity to subjectively evaluate them is limited for several reasons. In the study conducted by the University of Missouri, the team pointed to to the difficulties involved with the “Assessment of Outcomes.” They state that, “the type of data source or informant utilized as well as the timing of outcomes assessment relative to the active period of program operation,” affect the already difficult process of evaluating the outcomes of varying “patterns of interaction’ from program to program.
Having addressed these challenges in assessing effectiveness in mentoring programs overall, in addition to “best practices,” we will outline four factors that will define the way in which this report identifies an effective mentoring program. They will be: consistency, goal-oriented philosophies, mentoring relationship strength, and purpose-driven program structures.
JZAMP within the context of mentoring programs overall:
JZAMP employs many of the aforementioned theory and empirically based best practices as well as strong relationships between mentors and youths to ensure a successful mentorship program, improving academic and social outcomes for the students involved. The aspects of the program fall under the categories defined for assessing program effectiveness: consistency, goal oriented philosophies, mentoring relationship strength and purpose driven program structure. For the purposes of this report, we will focus on the particular JZAMP site of Wexler-Grant Community School in New Haven, CT and its partner university, Yale.
Goal Oriented Philosophy:
JZAMP was created in 2000 when then Connecticut State Representative Reginald Jones partnered with fellow school board member John Zimmerman with the aim of combatting school drop-out rates. This goal oriented philosophy is the foundation upon which the other effective strategies the program employs are built. To combat school drop out rates, JZAMP seeks students who are below grade level proficiency in reading and math; the students are selected based on recommendations from their fifth grade teachers and results of standardized tests administered by the state of Connecticut. The tests determine the baseline of the students proficiency in math and reading and the teachers recommend students who are highly motivated to do better in these areas.
With this benchmark goal of increasing proficiency in reading and math to combat the risk of dropping out firmly in place, mentors can build proficiency throughout the three years by setting smaller quarterly and semester goals of achievement for their mentees. Concrete goal setting is important for both mentors and mentees because “seeing oneself gain progressive mastery strengthens personal efficacy, fosters efficient thinking and enhances performance attainments” (Bandura, 1993). This self efficacy in combination with goal setting contributes to academic attainments (Zimmerman, Bandura, Martinez-Pons, 1992).
Students gain confidence by meeting goals they set in conjunction with, and with the support of, their mentor and improve academically. Examples of smaller goals set by some mentors and their mentees range from general improvement of grades, to speed and accuracy with which students complete specific types of math and reading problems in homework, to increasing the amount of time spent focused on work during academic time. Setting and reaching these goals allow both the mentor and mentee to gauge their academic progress over time .
Consistency:
This goal oriented philosophy is reinforced by the consistency of the program, another area in which JZAMP maintains mentoring effectiveness. Consistency is manifested both in the duration of the mentoring cycle as well as the frequency with which mentors and mentees work together. Both mentors and mentees are recruited to JZAMP knowing that the program lasts for a full three years. College students apply to mentor with the program at the end of their freshman year and are selected on the basis of their experience with tutoring and mentorship as well as their willingness to commit to the full three years of the program. During these three years, mentors and mentees meet twice a week for the duration of the school year–barring school holidays. This year to year, week to week, and day to day consistency is crucial to the achievement of the aforementioned academic goals because mentorship has been shown to increase in effectiveness over time (Grossman and Rhodes, 2002). Grossman and Rhodes found in a 2002 study that the benefits of a mentoring relationship are best achieved if the relationship lasts at least one year (Grossman and Rhodes, 2002). JZAMP’s three year duration ensures that not only the minimal benefits of a mentoring relationship can be achieved, but that they can be maximized over an even longer period of time.
Mentor Relationship Strength:
Strong mentor-mentee relationships that are also core to the success of the program. Herrera, Sipe and McClanahan identify eight characteristics that contribute to a strong mentoring relationship: mentor and mentee engagement in social activities; mentor and mentee engagement in academic activities; hours per month mentee and mentor spend together; decisions made about how mentors and mentees spend time; similarity of interests; prematch orientation and training; post match support and training from program staff; and age of the mentee (Herrera, Sipe, McClanahan, 2000). JZAMP builds mentor-mentee relationship strength along each of these eight metrics. The strong mentoring relationships of JZAMP are due in part to the duration of the program and the frequency with which mentors and mentees interact, discussed in the consistency section above. Engagement in social activities, academic activities, time management decisions, training, matching and support each fall under the category of purposeful program structure which will be discussed in the following section.
The mentor-mentee relationship is also strengthened by pairing mentees with mentors in a ratio no higher than 2:1. Because the mentor’s time is not split between many parties, the mentees receive more focused academic and social attention from their mentors. This focused attention allows mentors to tailor the time spent with their mentee or mentees to maximise effectiveness. In practice, this takes the form of concentrating on academic areas of weakness specific to the mentee or mentees; pushing the mentee or mentees to move at a specific pace; or spending focused social time getting to know mentees on a personal level.
Purpose Driven Program Structure:
The effectiveness of JZAMP is also owed to the structure of the program, both at its higher programmatic level and in the day to day structure at the schools, for this section we will examine Wexler-Grant School in New Haven and its partner university, Yale, as a case study.
JZAMP at Yale is administered through the university’s undergraduate student lead community service organization, Dwight Hall. Dwight Hall appoints a site director that acts as a liaison between the university and the foundation that supplies the funding for the program. Day to day operations of the program at the local middle school are administered by the student director appointed by the site director at Dwight Hall. This separation of overall programmatic administration from day to day operations at the school relieves the administrative burden on both parties, allowing for efficient running of the program. The two act in conjunction, trading information and reinforcing each others roles to maximize program effectiveness.
The Dwight Hall site director acts as support for the program, providing training and resources to the student director and mentors. The site director oversees the program’s budget, accounting for mentor pay, funding for supplies and field trips. The director also oversees the period of onboarding and training each each year for the mentors during which data from the previous year are assessed and improvements and adjustments are made to ensure a better experience for mentees.
The student director acts as on the ground support for the mentors–interacting with school administration and teachers to smooth the day to day operations of the program. The student director acts as a resource for the mentors on site, facilitating communication with teachers about mentee progress and keeping the school administration abreast of program activities.
A day of JZAMP at Wexler-Grant is as follows:
2:00- Mentors arrive before the end of the school day and prepare by bringing JZAMP materials to the classroom used for the program. Mentors arrive with any specific materials needed for that days activities and bring the materials left at the school to our mentoring site.
2:10- School day ends and mentors usher their mentees to the classroom and wait until everyone has arrived.
2:20-2:40- Mentors and students go to the gym or outside if the weather permits to decompress after the school day and relax before resuming academic activities. This is a period during which mentors and mentees can interact in a more casual and social setting. Mentors and mentees may play a game of basketball or tag, or sit and exchange stories about their days or engage in a discussion about current events. This is a time during which mentor and mentee relationships can be strengthened in a social setting.
2:40-3:00- Mentors and Mentees return to classroom for snacks, announcements and prepare for academic time. During this period, the student director may make announcements about upcoming field trips or group activities. Students also have the opportunity to share about their lives in a larger group setting through “Rose, bud, thorn” an activity in which students share something good that happened, something they’re looking forward to, and something negative that has recently happened. During this time, mentors may poll the crowd about upcoming school assignments that mentees can work on.
3:00-4:00- Mentors work with mentees on homework and projects, or tutor to reinforce areas of academic weakness. During this time, mentors and their mentees break off into their assigned matches and work on whatever mentor and mentee agree should be done that day. Mentors and mentees may employ goal setting by setting daily goals such as finishing x number of assignments or getting to a certain point in a larger homework packet assigned for the week. With both parties aware of the daily goal, mentors can chart a pace for their mentees and provide support needed to succeed for the day. Shared goal setting and small group or one on one pairing lends the interaction a collaborative feel rather than a teacher-pupil hierarchy that strengthens mentor and mentee bonds.

4:00-4:30-Mentors lead a session of academic enrichment, the theme of which changes weekly, giving each mentor a chance to elect the theme of the week. Academic enrichment themes can include but are not limited to political debate, historical discussion, and recent scientific discoveries. This time is intended to encourage students to engage in intellectual pursuit outside of work assigned in school. This time is opened with an introduction and transitions to an activity related to the topic, with the second day of mentoring building upon the first.

4:30-5:00 Mentors and mentees return to the gym or outside until transportation arrives to take students home.
This schedule is strictly followed each day of mentoring and ensures that mentees are getting the most out of their time with their mentors, both academically and socially.
These elements of consistency, goal oriented philosophy,mentoring relationship strength and purpose driven program structure have proven effective in improving academic outcomes for JZAMP mentees. JZAMP has achieved its goal of combatting drop out rates. JZAMP’s first cohort graduated high school in 2008 and JZAMP participants had a graduation rate of 85% (JZAMP, 2016), higher than the state average of 79.2% (Lohman, 2011) for that year. JZAMP mentees at Wexler-Grant outperform their school peers in both school assessments and standardized testing; two JZAMP mentees scored the highest in the schools administration of the PSAT 8/9 test.
TFA Within the Context of Training and Disseminating Universal Practices
This report has already established the fundamental differences between TFA and mentoring programs like J-Z AMP. It has indicated that the TFA model will be used in order to extrapolate methods by which mentoring “best practices” could be universally employed and applied. In this section, we will more concretely evaluate what elements of the TFA model would be most effectively applied to a “Mentor for America” model. This section will briefly elaborate on concrete elements of these practices to be implemented.
Broad Scope
Teach for America is both applauded and criticized for its broad recruiting efforts. More specifically, Teach for America seeks to encourage a diverse range of college students– regardless of their background or academic interests– in order to pull from a significant pool that selects for competitive applicants. At the point in which it most invested in recruiting, around 2013, Teach for America, “attracted 57,000 applicants, yielding a corps that year of 5,800 teachers.” (Washington Post, 2016)
This data begs questions pertaining to the reach with which Teach for America recruits. Critics argue that because of its mission to recruit in high numbers, Teach for America focuses marketing on people who are not necessarily interested in education, affecting TFA’s retention rate. (Donaldson, Johnson, 2011) These critics might cite the fact that more than two thirds of TFA teachers leave their positions at public schools beyond their two-year commitment. (Donaldson, Johnson) However, this data is limited given its framing. Though two thirds of TFA teachers leave their positions after their two year commitment, almost 90% of them remain in their positions during the first two years. We will now briefly explore this paradox, arguing that it is okay that a majority of teachers leave after their two year commitment given the leverage that this provides TFA in its recruiting efforts.
In analyzing this data, it is relevant to further explore the methods by which TFA goes about recruiting at this scope. One of the main marketing efforts that TFA employs in this effort is its emphasis on “exit options.” By “exit options,” we refer to the cues that it provides potential corps members pertaining to ways in which TFA will expand, rather than stunt, their future alternative career options. On one of its alternating website tiles, TFA emphasizes that corps members will, “join an extraordinary, diverse network 53,000 strong tackling inequity from every sector.” (TFA, 2017)
TFA asserts to its potential corps members that TFA will not lock them into a career path in teaching, using the fact that they can leave after two years as a selling point. Through we have explored the reasons why critics find this problematic, this report will argue that this framing and emphasis is beneficial.
This method is practical and beneficial for several reasons. Given that it targets people beyond those seeking to enter an education track, it increases its numbers substantially. TFA does this knowing that there is a teacher shortage, and that finding people that are good teachers, and who can fill the gaps in today’s teacher deficit, requires a broad selection method. This type of recruiting emphasizes the fact that effective teachers come in many different “shapes and sizes,” and that it is in many bests interests to welcome and acquire a diverse pool of teachers. By embracing the fact that their goal is not to commit teachers for a lifetime of teaching, TFA maximizes its ability to recruit a pool of diverse and effective teachers.
Establishing Commitment & Constant Contact
Recruiting a high number and wide variety of corps members does not cause Teach for America to compromise in its high expectations for corps members. From the beginning of its recruiting path for corps members, it ensures commitment through a high-level investment threshold on the part of the potential new corps member.
In practice, this means that Teach for America develops a constant feedback relationship with its corps members, establishing a level of commitment that goes beyond average onboarding practices.
From its application process, TFA requires new corps members to dedicate time to submitting personal statements, answering purpose questionnaires, and complete activities that require upwards of five hours. (TFA, 2017) After the application process, TFA requires all potential new corps members to conduct a day-long in-person interview that is tiered to challenge the applicant’s individual and collaborative background, goals, and intentions. (Glassdoor, 2016)
Once corps members are hired, the methods by which they are prepared to teach in classrooms vary from region to region. In TFA’s New York Region, for example, new corps members are required to attend multiple preparation webinars, upload videos pertaining to their intentions and goals, and participate in a busy “grooming” process where they are prepared for the licensing process and placement. (Teacher Certification Degrees, 2017)
In analyzing this process, it is relevant to extrapolate the broad factors of consistency, commitment, and contact. Teach for America ensures teacher commitment— amounting at the previously cited 90% retention rate during the two-year placement– through creating a process of substantial investment on behalf of its new teachers.
Self-Evaluative Tools
Teach for America is capable of holding its large pool of new corps mentors universally accountable through its methods of self-reflection and evaluation. More tangibly speaking, TFA’s “Teaching As Leadership Comprehensive Rubric” is a model of the ways in which TFA requires and perpetuates the importance and magnitude of this process. (Teaching as Leadership, 2017) This rubric provides new corps members with the framework from which to set goals that are tangible and tiered; they seek to assure that new teachers constantly improve themselves through self-evaluation and incrementally higher goals.
The “Self-Evaluative Tools” element of Teach for America’s “universal practices” is perhaps one of the most worthy of extrapolation and ubiquitous implementation. This is due to the fact that it ensures constant increased output from each of its new teachers and staff members, thus generating optimal results for children in classrooms.
Combining the Two: Scalability of Good Mentoring
Implementation
This report has extrapolated “best practices” from J-Z AMP, mentoring programs at large, and Teach for America in order to consider the ways in which the United States could improve statistics that currently demonstrate the ineffective nature of youth mentoring programs. (Aben et al., 2006) This section will explore how these aspects can be tangibly combined in order to improve mentoring programs nationwide.
In implementing a program with such goals and practices, we propose a large-scale, centralized mentoring institution that recruits, trains, and places mentors in localized regions. These regions are broken down into campuses and schools of contact. However, the process of creating such a hierarchy allows for the “universal best practices” implemented by TFA to be disseminated throughout the United States.
Mentor for America will recruit, train, and place college-aged mentors within partner schools throughout the country, seeking to universalize the effective strategies and structures utilized in JZ AMP. It will use universities, as does TFA, as the centers in which these actors are prepared to effectively mentor in schools. The ultimate goal of this organization will be to implement the best practices of JZ AMP and TFA to universalize good mentoring throughout the United States, and change the status quo of mixed successes in the variety of programs that currently exist in the country.
Potential Problems
The implementation of the expansion of JZAMP following the TFA scalability model is not without potential problems. Scaling any program, despite its effectiveness and organization at the micro level, will have its problematic areas at the macro level.
The first potential problematic area may arise in funding the program. JZAMP is funded through a grant from the Jones-Zimmerman Foundation to pay for all costs associated with the program. Securing adequate funding to run the program on a larger scale may be difficult. This could be mitigated by addressing the need for funding through each university’s Dwight Hall equivalent.
The existence of a Dwight Hall like entity within each university is also unlikely and may cause problems in implementation. Embedding JZAMP at Dwight Hall aids in the smooth running of the program, but may not be necessary. There would have to me extensive structure building at the new universities to accommodate a program of this type.
Conclusion
Existing literature pertaining to mentoring programs in the United States shows mixed results with regard to their effectiveness. At this point, the benefits of mentoring programs are not concretely defined or discernable, and many studies point to net losses. This report identified one of the reasons for these existing results: given an absence of ubiquitous best practices, mentoring programs fall on a broad spectrum of general success.
Due to the broad range of mentoring programs and corresponding success rates in the United States, this report has considered the ways in which uniting best practices pertaining to mentoring, and those pertaining to running an effective, nation-wide educational program (TFA), might increase success rates of mentoring programs around the country.
From a proscriptive standpoint, this report has suggested the implementation of a mentoring-based program modeled after the best practices of Teach for America’s recruiting, training, and placement practices and JZ AMP mentoring techniques called Mentor for America.
Moving forward, there is room to consider the practical elements of implementing a program such as Mentor for America. More specifically, it will be relevant to consider financing, fundraising, staffing, leadership hierarchies, and distribution channels. Though these factors have not been examined at this point, the theoretical evidence of the need and projected success rate of such a program has been established in this report.

Works Cited
ALLEN, TAMMY D., LILLIAN T. EBY, and ELIZABETH LENTZ. “THE RELATIONSHIP BETWEEN FORMAL MENTORING PROGRAM CHARACTERISTICS AND PERCEIVED PROGRAM EFFECTIVENESS.” Personnel Psychology. Blackwell Publishing, 13 Feb. 2006. Web. 04 May 2017.
Bandura, A. (1993). Perceived self-efficacy in cognitive development and functioning. Educational psychologist, 28(2), 117-148.
Director, Judith Lohman Assistant. DIFFERENCES IN GRADUATION RATES FOR THE CLASS OF 2008. N.p., n.d. Web. 04 May 2017.
Grossman, J. B., & Rhodes, J. E. (2002). The test of time: Predictors and effects of duration in youth mentoring relationships. American journal of community psychology, 30(2), 199-219.
Herrera, C., Sipe, C. L., & McClanahan, W. S. (2000). Mentoring school-age children: Relationship development in community-based and school-based programs.
“How to Apply.” Teach For America. N.p., 24 Apr. 2017. Web. 04 May 2017.
“J-Z AMP™ – About Us.” About J-Z AMP. N.p., n.d. Web. 04 May 2017.
Morgaen L. Donaldson and Susan Moore Johnson, Phi Delta Kappan. “TFA Teachers: How Long Do They Teach? Why Do They Leave?” Education Week. N.p., 10 Mar. 2017. Web. 04 May 2017.
“New York Teacher Certification and Licensing Guide 2017.” Teacher Certification Degrees. N.p., n.d. Web. 04 May 2017.
North End Action Team. N.p., n.d. Web. 03 May 2017.
North End Action Team. N.p., n.d. Web. 03 May 2017.
Post, The Washington. “Teach for America Retools Efforts to Recruit Top Prospects.” NOLA.com. N.p., 01 June 2016. Web. 04 May 2017.
“So Why You?” Teach For America. N.p., n.d. Web. 04 May 2017.
“Teach for America Interview Questions.” Glassdoor. N.p., n.d. Web. 04 May 2017.
“Teaching Leadership Skills.” (n.d.): n. pag. Web.
Zimmerman, B. J., Bandura, A., & Martinez-Pons, M. (1992). Self-motivation for academic attainment: The role of self-efficacy beliefs and personal goal setting. American educational research journal, 29(3), 663-676.
Teaching for Two: Public Education and Pregnant Teens
By Eliza Scruton and Emily Patton
Executive Summary
Given the well-documented negative psychosocial and economic effects on the outcomes of teenage parents (Kiselica & Pfaller, 1993; Coren et al., 2003; Freudenberg & Ruglis, 2007; National Conference of State Legislatures, 2013; Einhorn, 2015), we believe it is vital that school systems offer some means of providing the resources they need to mitigate these effects. While many school districts offer no special support to teenage parents, those that do generally follow one (or sometimes both) of two models: creating a standalone school for pregnant and parenting teenagers, or providing wraparound services through mainstream schools. Currently, districts seem to be trending toward the latter model, with many alternative “pregnancy schools” across the country having closed within the past few years (Einhorn, 2015; Swaby, 2016). This trend is in part due to declining rates of teen pregnancy (Center for Disease Control, 2016) and in part due to a changing social landscape (Swaby, 2016). This essay draws on both empirical and anecdotal data to evaluate the potential impacts of this transition, and concludes that the location at which support services are provided to pregnant teens is less important than the quality and accessibility of the services themselves.
Introduction
This policy report concerns the ways that public schools can provide support and resources to pregnant and parenting teenagers. In it, we highlight the advantages and drawbacks to two general models. The first of these is a model in which pregnant and parenting teens attend a separate school from their non-parenting peers, and receive the aforementioned services in the context of that school. The second is the “wraparound services” model, wherein teenage parents receive services (such as medical care, counseling, and coordination with social workers (Swaby, 2016)) within the schools they already attend, provided by an external source.
Statistically, standalone schools for pregnant and parenting teenagers boast much higher graduation rates than the national average for this demographic; however, it remains unclear whether this type of success depends upon the standalone school model as opposed to a wraparound services model. Alternative schools provide a number of advantages, in that they provide teen mothers with a social network of their peers (Bowens, 2016) and a non-judgmental social environment (Halpern, 2011). Furthermore, their comparatively high staff-to-student ratio allows every student to receive a high level of individual attention (Halpern, 2011; Bowens, 2016). However, in many cases, pregnant teenagers opt to remain in their own schools (Orson, 2016); moreover, some have critiqued the practice of setting up alternative schools as a means to cloister teenage mothers out of sight (Einhorn, 2015), harkening back to an outdated understanding of teenage pregnancy as a social contagion (Swaby, 2016).
In order to to explore the impact of transitioning from standalone schools to wraparound services, we focus primarily on the case of the Polly T. McCabe Center in New Haven, Connecticut. McCabe, until recently, operated a brick-and-mortar school for pregnant teens, but has transitioned in the last year to offering wraparound services through other public high schools (Halpern, 2011; Swaby, 2016). Based on evidence from this school and others like it, we argue that the closing of a standalone school may be more beneficial to students provided that they continue to receive the same amount of services and resources through the wraparound program.
Background
Teenage pregnancy in the United States today is at record lows. The CDC reports that in 2014, the birth rate for women aged 15-19 years was 24.2 per 1000 women, a 9% decrease from the previous year. This decline is consistent with overall trends since the early 1990’s, depicted in Figure 1 below, as reported by the CDC. The underlying causes of declining teenage pregnancy rates are not entirely understood, though some studies suggest that increased contraceptive use is more responsible than delayed sexual activity (Lindberg et al., 2016).

Figure 1: Trends in live births among women aged 15-19 years
Still, though, teenage pregnancy remains an important public health issue: the US has the highest rate of teen pregnancy among Western industrialized nations (CDC), and pregnancy is the leading cause of high school dropout among girls (Freudenberg & Ruglis, 2007). Reports of the precise graduation rate of pregnant and parenting teenagers vary somewhat: according to a 2013 report from the National Conference of State Legislatures, only about 40% of teenage mothers complete high school; some report the rate slightly higher, at 50% (Einhorn, 2015). Either of these figures, though, is far lower than the national average high school graduation rate, which for public school students was 82% as of 2013 (National Center for Education Statistics, 2016). Because of their increased dropout rate, as well as societal stigma surrounding them and a number of other factors, teenage parents and their children are at risk of experiencing worse psychosocial and socioeconomic outcomes than their peers (Kiselica & Pfaller, 1993; Coren et al., 2003). To some extent, teenage pregnancy can be seen as a symptom of socioeconomic hardship rather than a source (Charles, 2014; Manlove, 1998): teenage pregnancy tends to follow school disengagement, as well as precede it, and rates of teenage pregnancy are far higher in areas with higher crime and poverty rates (Crane, 1991). Even after adjusting for risk factors for teen pregnancy (such as growing up in poverty or being raised by a single parent), though, the negative effects on academic performance persist (CDC). The goal of support programs for pregnant and parenting teenagers, put simply, is to buck these trends: generally speaking, programs that provide support for teenage parents seek to reduce their dropout rates, including through the prevention of further unplanned pregnancies (teenage parents of more than one child are even more likely to drop out than those with only one).
Institutional support systems for pregnant and parenting teenagers, in general, are few and far between. In the wake of declining teen pregnancy rates nationwide, many programs intended to provide support to parenting youth have been shut down (Einhorn, 2015). Nevertheless, pregnant and parenting teenagers continue to be disadvantaged in society, and given the decline in outcomes for teenage parents, it is vital that those adolescents who do become parents receive adequate support, and are not simply swept under the rug by school districts. Many schools provide programs that focus on preventing teen pregnancy in the first place. These programs have been at least somewhat effective in increasing teen contraceptive use (Bennett & Assefi, 2005), particularly when they follow an “abstinence-plus” (as opposed to an abstinence-only) model, wherein information on contraception is included in the curriculum. Programs that provide resources to students who have already become pregnant or had children, though, are much less common: a 2012 study by the National Women’s Law Center found that only 26 states provide institutional support for pregnant and parenting teens, and only 18 explicitly disallow discrimination against teenage mothers. According to the NWLC’s study, pregnant and parenting teenagers in many schools are expelled, barred from school activities, and penalized for pregnancy-related absences.
One option for districts seeking to provide such support is to open a school designed to serve only pregnant and parenting students. In addition to services like medical care, daytime childcare, and counselling, these schools provide parenting students with a social network of other adolescent parents. In many cases, these alternative schools were founded with the intention of eventually reintegrating students into their original high schools (Orson, 2016). Some of these programs also operate through charter schools. Some of these schools, such as Pathways Academy in Detroit, provide education to their students through online courses rather than through a more traditional classroom setting (Einhorn, 2015). Students at many of these programs have cited them as a sole or significant factor in the successful completion of their high school diplomas (Konz, 2015; Skinner, 2014; Einhorn, 2015; Halpern, 2011). At the same time, though, there is some debate about the social benefits of these alternative schools. While they do provide teen mothers with a social network of their peers, some argue that cloistering teen mothers in a separate school away from their non-parenting counterparts perpetuates social stigma surrounding them (Einhorn, 2015) Programs such as these, in the context of public school districts, are not terribly common, but do exist in small number around the country.
These alternative schools are, however, dwindling in number. Several of these programs, including Detroit’s Catherine Ferguson Academy and Baltimore’s Lawrence Paquin Middle/High School, have been shut down in recent years (Einhorn, 2015). The Jefferson County Public School (JCPS) district in Kentucky is considering consolidating the Georgia Chaffee Teenage Parent Program (TAPP), which currently operates two schools, into one building in the coming years (Ross, 2015). In New Haven, the Polly T. McCabe Center recently made the transition from existing as a separate school for teen mothers to an organization that provides wraparound services through more traditional schools (Swaby, 2016). Many districts that have shut down alternative schools for pregnant students have cited budgetary concerns among their reasons for doing so (Ross, 2015; Swaby, 2016). Given the historically low rates of teen pregnancy today, it is unclear whether the benefits of running alternative schools for pregnant students are worth the added expenditures. However, monetary concerns and declining rates of teenage pregnancy are not the only reasons for the closing of many of these programs: changing societal norms also affect the demand for alternative schools for pregnant students. For example, in the case of Polly McCabe, both the laws surrounding pregnant students and the popular understanding of teenage pregnancy have changed drastically since its founding in 1966 (Swaby, 2016). At that time, pregnant students in New Haven were not allowed to attend mainstream high schools; under Title IX, this is no longer the case (Orson, 2016). Furthermore, teen pregnancy is not seen as “contagious” in the way that it once was.
Outside of alternative programs specifically for teenage parents, there are other ways for districts and states to provide resources to teenage parents, either through financial support or through subsidized services. The Connecticut Department of Education, for example, provides a program known as the Support for Pregnant and Parenting Teenagers (SPPT) grant, which operates in the five districts statewide with the highest rates of teenage pregnancy. This program more closely resembles the “wraparound services” model that New Haven’s Polly T. McCabe Center has recently transitioned to. The SPPT grant provides resources to teenage parents within existing comprehensive high schools. These services include family support, referrals to prenatal care services, child care, and parenting education. One feature of the SPPT grant, which is not generally present in programs like Pathways Academy in Detroit, JCPS’s TAPP schools, or even the Polly T. McCabe Center, is a particular focus on providing resources for teenage fathers (Connecticut State Department of Education, 2015), with the goal of increasing father involvement in their children’s lives.
Wraparound services are generally provided by state or local governments, rather than by the federal government. As such, the precise nature of these wraparound services varies significantly between programs. In the case of Polly McCabe, their six-person staff includes two outreach workers and one social worker, though the center has requested funds to hire an additional outreach worker and social worker for the upcoming school year (Swaby, 2016). These staffers provide services to pregnant and parenting mothers throughout the district. Middle school students who become pregnant also have the option of receiving schooling through New Haven’s “homebound” program, wherein students who are unable to attend school (generally due to illness or expulsion) can receive up to two hours of instruction per day in their own homes (Bailey, 2014; Swaby, 2016). One issue that still remains to be fully dealt with is that of how to provide affordable childcare to parenting teenagers during the school day: in New Haven, the only mainstream school with an operating daycare facility is Wilbur Cross High School. However, the Board of Education is considering opening another facility, possibly at Hillhouse High School or the Reginald Mayo Early Childhood School. Polly McCabe also partners with the LULAC Head Start Daycare Center, which continues to operate at the site of McCabe’s standalone school. Students receiving McCabe’s wraparound services are not required to pay for the childcare their children receive through LULAC (Bowens, 2016). In addition to the resources provided to mothers, McCabe also provides outreach to teenage fathers to connect them to jobs and other services.
Analysis: Evaluating the models
There is a wealth of empirical evidence–both qualitative and quantitative–that supports the claim that alternative schools for pregnant teens can have a positive impact on not only the educational outcomes of teen parents, but also the health outcomes of both parents and children. A study of New Haven’s Polly T. McCabe Center for Pregnant Adolescents found reduced incidence of repeat childbearing among women who enrolled at the center (Advocates for Youth, 2009). Within six years postpartum, those who did not have another child not only had higher educational attainment, but were also less likely to rely solely on public assistance to support their families (Advocates for Youth, 2009). At the Laurence Paquin School for pregnant and/or parenting teens in Baltimore City, participating students were found to have higher educational aspiration, better reproductive health outcomes, higher contraceptive use, and more breast-feeding practice and intention than those of their non-participating counterparts (Amin et al, 2006). Detroit’s Catherine Ferguson Academy, which was in operation from 1986 through 2014, once boasted a graduation rate of 90%–a significant increase from the estimated national average of 50% (Einhorn, 2015). Other similar models have have shown students to have similar improvements in graduation and health rates (Alford, 2009, Einhorn, 2015; Halpern, 2011).
Whether these outcomes are unique to these alternative schools–or whether they could be replicated through other programs–still remains to be seen. After all, in most alternative schools, the main difference lies not in the type of facility used or even the pace or content of curriculum, but in the range of auxiliary resources and services that the school can provide, as well as the level of individual attention that each student receives from the school’s teachers and staff. This is particularly salient given the fact that the majority of the resources that alternative schools are able to provide are social services, especially when it comes to counseling. In fact, one the biggest advantages cited by both students and administrators in successful alternative schools was the degree to which the teachers and administrators could be involved in their students’ lives, both inside and outside the classroom. This high level of engagement serves to not only encourage academic achievement, but also help students overcome external barriers that might discourage them from completing their education. In an article from 2015, the principal of the Detroit’s Pathways school described spending evenings and weekends visiting absent and prospective students (Einhorn, 2015). At other schools like Polly T. McCabe, staff members are involved in anything from helping students search for jobs to resolving interpersonal conflicts; one principal even drove a student to the hospital to give birth when her boyfriend refused to help (Halpern, 2011). This depth of involvement is enabled by the fact that alternative schools for pregnant women have a much higher staff to student ratio than other public schools. In this sense, one could argue that the key to ensuring the success of pregnant teens isn’t so much dependent on their segregation from a regular student body as it is the school’s ability to provide them with a network of support that is sufficient enough to allow them to focus on school, rather than having to navigate the difficulties of pregnancy alone.
Another way in which alternative schools alleviate pressure from their students lives is through financial support, to the extent that these schools are providing students with services and resources that they would otherwise have to pay for themselves, they offer a form of financial support. This is especially true of schools that offer child care, which can often be so prohibitively expensive that it is cheaper for young mothers to stay home rather than get a job. Other schools, like the Early Beginners Program, provide access to tangible goods including used books, maternity clothes, toys, and even weekly free diapers (Skinner, 2014). Much like counseling, these resources need not be exclusively available through a separate school facility, and could be incorporated into a wraparound services program.
The idea that students will succeed better in school when they receive more resources and attention is not exclusively applicable to pregnant women. As one journalist commented, reflecting on the success of a former McCabe student: “Perhaps she is an example of what good can come when schools don’t mainstream students with special needs; but her success may also simply indicate that any time a school system can afford to lavish attention on students who might otherwise be neglected, great things can happen.” (Halpern, 2011). It is possible that the reason why alternative schools are successful are because they are often geared towards exactly these kinds of students. Analyses of data from the National Survey of Family Growth have shown a significant correlation between socioeconomic status and teen pregnancy, with those of lower socioeconomic status being more likely to get pregnant as a teen (Hunter, 2012). Another study comparing teen mothers to their closest peers such as childless sisters or pregnant teens who had miscarried) found that the negative impact of having a child itself was marginal compared to the impact of a disadvantaged background (Halpern, 2011). In this sense, one of the most important roles of alternative schools for pregnant teens may not be mitigating the difficulties of pregnancy, but rather mitigating the obstacles of poverty.
One aspect of alternative schools that is less easily replicable in a public school setting is the community of peers that the space inherently provides. This community can serve not only as a source of positive support, but also as a shield from negative outside influences. As one McCabe student summarized: “The best thing about being [at McCabe] is that nobody judges you – nobody puts you down for being pregnant. We all understand each other; we are all going through similar situations” (Halpern, 2011).
There is less comprehensive research and discussion on the efficacy of wraparound services compared to separate brick-and-mortar schools. The debate between the two options is centered largely on the issue of funding, with the former costing far less than the latter. In the case of Polly T. McCabe, the decision to close the school building was primarily an issue of budgetary concerns. According to New Haven’s district director of instruction, shutting down the center would mean a cost reduction of $135,306 for the principal’s salary (Swaby, 2016). The amount that the state spends annually on services for the program’s enrollees, by comparison, is $175,000 (Swaby, 2016). This money will presumably be channeled into the wraparound services which would replace the school’s official programming. In addition to cutting costs, wraparound services can also provide students with the opportunity to stay integrated in their school community, where the academic rigor and variety of course offerings may be better than their usual alternative school. This issue has come up in the debate over Polly T. McCabe, as well as other debates around the country (Konz, 2015).
Conclusion
For many teens around the country, teenage pregnancy can present a significant obstacle when it comes to the completion of their education. However, if these obstacles can be mitigated through public services, the odds of teenage mothers succeeding in graduation can be raised significantly. In our evaluation of these two programs, we have concluded that while schools for pregnant teens may provide teen mothers with a safe and inclusive environment in which they can navigate the difficulties of their pregnancy and impending motherhood, the success of these schools is perhaps less dependent on the fact that they are separate than it is the fact that they are well resourced. With that in mind, we do not reject the idea of wraparound services, but rather embrace them, provided that the depth and quality of these services remains the same as they would be at an original school.
References
Alford, S (2009). Science & Success: Programs that Work to Prevent Subsequent Pregnancy among Adolescent Mothers. Advocates for Youth. Retrieved from http://www.advocatesforyouth.org/publications/1324?task=view
Amin, R., Browne, D.C., Ahmed, J. et al (2006, April). A Study of An Alternative School for Pregnant and/or Parenting Teens: Quantitative and Qualitative Evidence. Child and Adolescent Social Work Journal. 23(172). doi:10.1007/s10560-005-0038-1
Bailey, M. (2014, April 16). Homebound program under review. New Haven Independent. Retrieved from http://www.newhavenindependent.org/index.php/archives/entry/homebound/
Bennett, S. E., & Assefi, N. P. (2005). School-based teenage pregnancy prevention programs: a systematic review of randomized controlled trials. Journal of Adolescent Health, 36(1), 72-81.
Bowens, A (Host and Producer). (2016). Self-love, 3 different ways [Radio interview]. Alisa’s Culture Cocktail. New Haven: WNHH Community Radio.
Center for Disease Control (2016, April 26). About Teen Pregnancy. Retrieved from https://www.cdc.gov/teenpregnancy/about/index.htm.
Charles, B. (2014, March 22). Teen Pregnancy in Connecticut: City birth rates twice state average. New Haven Register. Retrieved from http://www.nhregister.com/general-news/20140322/teen-pregnancy-in-connecticut-city-birth-rates-twice-state-average.
Connecticut State Department of Education (2015, February 20). Support for Pregnant and Parenting Teens Grant. Retrieved from http://www.sde.ct.gov/sde/cwp/view.asp?a=2678&Q=334262
Coren, E., Barlow, J., & Stewart-Brown, S. (2003). The effectiveness of individual and group-based parenting programmes in improving outcomes for teenage mothers and their children: A systematic review. Journal of adolescence, 26(1), 79-103.
Crane, J. (1991). The epidemic theory of ghettos and neighborhood effects on dropping out and teenage childbearing. American journal of Sociology, 96(5), 1226-1259.
Einhorn, E. (2015, June 3). Teen pregnancy is still a problem– school districts just stopped paying attention. The Hechinger Report. Retrieved from http://hechingerreport.org/teen-pregnancy-is-still-a-problem-school-districts-just-stopped-paying-attention/
Freudenberg, N., & J. Ruglis. (2007, October 15). Reframing School Dropout as a Public Health Issue. Preventing Chronic Disease, 4(4), pp. 1-11.
Halpern, J. (2011, February 27). The Miracle of Polly McCabe. Boston.com. Retrieved from http://archive.boston.com/lifestyle/articles/2011/02/27/new_haven_school_educates_just_one_kind_of_student_pregnant_teens/
Hunter, Lori M (2012, April). U.S. Teen Birth Rate Correlates With State Income Inequality. Population Reference Bureau. Accessed at http://www.prb.org/Publications/Articles/2012/us-teen-birthrate-income.aspx
Kiselica, M. S., & Pfaller, J. (1993, September). Helping Teenage Parents: The independent and collaborative roles of counselor educators and school counselors. Journal of Counseling and Development, 72(1), pp. 42-48.
Konz, A. (2015, March 15). JCPS exploring changes to teenage pregnancy alternative school program. WDRB news. Retrieved from http://www.wdrb.com/story/28478485/sunday-edition-jcps-exploring-changes-to-teenage-pregnancy-alternative-school-program
Lindberg, L., Santelli, J., & Desai, S. (2016, November). Understanding the decline in adolescent fertility in the United States, 2007–2012. Journal of Adolescent Health, 59(5), 577-583.
Manlove, J. “The influence of high school dropout and school disengagement on the risk of school-age pregnancy.” Journal of Research on Adolescence 8.2 (1998): 187-220.
National Center for Education Statistics (2016, May). Public high school graduation rates. Retrieved from https://nces.ed.gov/programs/coe/indicator_coi.asp.
National Conference of State Legislatures (2013, June 17). Postcard: Teen pregnancy affects graduation rates. Retrieved from http://www.ncsl.org/research/health/teen-pregnancy-affects-graduation-rates-postcard.aspx#2
National Women’s Law Center (2012, June 18). A Pregnancy Test for Schools: The Impact of Education Law on Pregnant and Parenting Students. Retrieved from https://nwlc.org/resources/a-pregnancy-test-for-schools-the-impact-of-education-laws-on-pregnant-and-parenting-students/
Orson, D. (2016, September 26). With Lower Teen Pregnancy Rates, New Haven Adjusts to Keep Teen Moms in School. WNPR. Retrieved from http://wnpr.org/post/lower-teen-pregnancy-rates-new-haven-adjusts-keep-moms-school
Ross, A. (2015, March 9). JCPS considers cutting $1.7M from alternative schools. The Courier Journal. Retrieved from http://www.courier-journal.com/story/education-blog/2015/03/09/jcps-alternative-schools-funding-budget/24628223/
Skinner, K. (2014, December 22). In one Gulf Coast program, every teen mom graduates. The Hechinger Report. Retrieved from http://hechingerreport.org/one-gulf-coast-program-every-teen-mom-graduates/
Swaby, A. (2016, April 7). School Shrinks as Teen Moms Mainstream. New Haven Independent. Retrieved from http://www.newhavenindependent.org/index.php/archives/entry/polly_mccabe/
Swaby, A. (2016, September 22). Polly McCabe Transformed. New Haven Independent. Retrieved from http://www.newhavenindependent.org/index.php/archives/entry/polly_mccabe_mainstream/
Bilingual Education in Connecticut: Failing Those Who Need Us
https://docs.google.com/document/d/11V0LHpV0TQEAk9rOUSoNrFJKU8nyOpkvY8hbEnFZJZE/edit#Introduction:
One of the most controversial topics in the history of American education has been Bilingual Education or ESL education. In the 1980s, the U.S. English movement sought to make English the official language in the United States. Fortunately, the country has mostly moved away from this rhetoric that was mostly anti-immigrant and a lot of the policy now recognizes the importance of valuing native languages and seeks to preserve them. Despite these monumental advances, the education of bilingual students continues to be undermined and attacked by many factors. For the purposes of this policy memo, I will focus on the state of Connecticut. The education of (English Language Learner) ELL students continues to be underserved by the state.
The number of students in the state of Connecticut continues to expand, but it is still identified as a program that is suffering from a variety of factors. The state is currently facing a teacher shortage (not enough qualified candidates are applying for the positions available in bilingual education). They continue to underperform on state tests when compared to native English speakers and they have lower graduation rates. They are in diagnosed with a learning disability at a higher rate than the national rate, and they are more likely to be disciplined or suspended than the rest of the student body. Connecticut State Department of Education, 2015a). The English Learners site on the Connecticut State Department of Education (CSDE) page has very few resources for families in their native languages (Connecticut State Department of Education, 2017c). Finally, although the CSDE highlights the importance of getting all students to be excelling students, there are no resources on the website to help them or their teachers know about the college process for someone with limited English proficiency. In this policy memo, I will focus on a few proposals that encourage the advancement of this group of students so they can take their rightful place as members of our community.
We must encourage a certification process that allows qualified teachers from other states to move easily to Connecticut and to start teaching as soon as possible. We must try to reflect the demographics of the children in the staff. We must increase the number of months that ELL students can have in a bilingual program from 30 months to 60 months when possible and introduce Dual Language Bilingual Education Program in districts where one language is overwhelmingly dominant among the ELL students. We must increase the amount of money that the state invests on ELL/Bilingual education—it is currently $54.52 annually per child (Candelaria and Roldán, 2015). We must Improve the English Learners page on the CSDE website so students and parents can access it easily. We must believe that these students can get into competitive colleges and provide services that allow them to take the TOEFL exam if they are eligible. We must add a page on the CSDE website that provides not just information for them, but also for their families, counselors, teachers, and principals about the available options for higher education. All districts must also be instructed to create these pages on their websites.
Background:
Bilingual education has had a turbulent history in the United States. States and the country have not always been receptive to the idea of encouraging the teaching of a language other than English. The great expansion of the United States during the nineteenth and early twentieth century brought pride to Americans, but also fear. U.S. officials wanted all Americans to have something in common, and they looked at the possibility of an official language. This also put emphasis on making “American” mean assimilation of language and culture (García Garrido & Fernández Álvarez, 2011). “In 1968, Congress passed an amendment to the Elementary and Secondary Education Act (ESEA) of 1965 known as the Bilingual Education Act” (Kim, Y., Hutchison L. A., & Winsler A., 2015, p. 239). This helped ELLs receive services in their native languages. In the 1980s the U.S. English movement identified a bilingual country as a threat to America and its identity (García Garrido & Fernández Álvarez).
In the early 1990s, the opposition for bilingual education, at least at the federal level, dwindled. Unfortunately, as soon as President W. Bush came into office, he undermined bilingual education. Congress passed the No Child Left Behind (NCLB) in 2001 (San Miguel, 2004). This act put pressure on bilingual programs to prioritize the learning of English (Kim, et al., 2015). It imposed penalties on schools that failed to make “adequate yearly progress” or to test less than 95 percent of students (García Garrido & Fernández Álvarez, 2011, p. 52). It did not address the shortage of teachers for ELL programs (San Miguel, 2004). The passage of Every Student Succeeds Act (ESSA) by President Obama in 2015 granted more freedom to states on testing, but it required them to track students, especially high-need students. It “requires—for the first time—that all students in America be taught to high academic standards that will prepare them to succeed in college and careers” (U.S. Department of Education, 2017). It has now allowed for ELLs to be tested in their dominant language or at least have access to translation tools during assessments. (Taylor, 2016).
In the state of Connecticut, students are entitled to receive bilingual education if in a given school there are at least twenty students in the same language group who have been identified as ELL. (Connecticut State Department of Education, 2015c). If a school has less than twenty students, or if the student’s parents have opted out of the bilingual program in the school, the school is still required to grant ELLs access to an ESL classroom. This means that even though English in the language of instruction, it still focuses on obtaining English proficiency and mastery of the subject matter. According to Section 10-4a of the Connecticut General Statutes states, every child must receive a “suitable program of educational experiences,” and this has been interpreted as an obligation of the state to provide adequate ELL education. (Connecticut State Department of Education, 2017b). There is “no state legislation that mandates and describes specific requirements of a English as a Second Language program,” the Civil Rights Act of 1964 requires that all states provide suh services (Connecticut State Department of Education, 2015c, p. 7). Although the state has to ensure support for these students, there are a variety of options to do so and I provide a small glimpse of the most popular programs used in the state.
In previous decades, schools practiced “submersion” (A.k.a sink-or-swim) methods where ELL students were placed in an all-English classroom all day every day. Thankfully, this program was deemed illegal after a U.s. Supreme Court case( Lau v. Nichols-– 1974). The second method most used is English as a Second Language (a.k.a. ESL). Students attend classes in English but they are pulled out of the classroom to work with ESL certified teachers. The third option is the Transitional Bilingual Education program. Instruction is in the student’s native language and in English and as the year progresses, the use of the native language is decreased while English is used more. A fourth option is the Developmental Bilingual Education program. Although this program is very similar to TBE programs, its goal is bilingualism and biliteracy. This program is normally a 5 year program that is hardly feasible in the state because ELLs are restricted to 3 years of ELL education. Finally, there are Two-way Bilingual Programs. The goal of this program is to put English-speaking students and ELL students who belong to the same language group and get them to achieve bilingualism. Instructors need to teach in both languages. Students benefit from the program the longer they find themselves in it and in the state of Connecticut, the students can remain in it indefinitely (as opposed to having a limit of 30 months like in the other programs) (Connecticut State Department of Education, 2015c, pg. 18-19).
The state of Connecticut must take on the tough task to provide a rigorous and rewarding education to ELL students. It must make sure that its students are ready to go into the world and be able to interact within their communities. The Connecticut State Department of Education is aware of many of the crises in bilingual education across the state. In the following section I identify key demographic characteristics of ELLs and also some of the problems facing bilingual education in the state of Connecticut.
Evidence/Data Analysis
Who is an ELL? Who determines if they need an EL program? How?
Identification of English Learners
“English learners must be identified within 30 days after the beginning of the school year or within the first two weeks following their enrollment if it occurs during the year” (Connecticut State Department of Education, 2015c, p. 10). Upon enrollment, all parents/guardians must complete the Home Language Survey which inquires about the languages the kid has been exposed to at home. Secondly, the school must administer a language proficiency test. The Language Assessment Scales (LAS Links) allows the student to be tested in English and his/her/their native language. The results of this exam, or other components of the student;s academic standing could be considered to determine whether or not the child is an English Learner (Connecticut State Department of Education, 2010). [ref]
Schools now administer the Smarter Balance Assessment which is considered a more rigorous test to only allow students who possess the necessary oral and academic skills to succeed in a regular classroom (Connecticut State Department of Education, 2015a) [ref]
Most Dominant Language
 (Connecticut State Department of Education, 2015a, p. 1)
Spanish is the most common native language among ELLs (72.4 percent of ELL students) (Connecticut State Department of Education, 2015a).
Free and Reduced Lunch

“ELs were more than twice as likely as others to be eligible for free or reduced-price meals (76.8 percent compared with 35 percent), illuminating that many ELLs have multiple service needs” (Connecticut State Department of Education, 2015a, p. 4).
ELLs with Disabilities
This is one of the most challenging areas of ELL education. Several reports have exposed the high levels of disabilities that are found among english learners. In 2011, the Connecticut Administrators of Programs for English Language Learners published a handbook. In one of their sections, they caution teachers to be careful about over-identification of learning disabilities, but it also warned teachers that to wait several years to report could be incredibly detrimental for an ELL with a disability. Unfortunately, “[since 2010], the numbers of ELs who were identified for special education increased by 36.1 percent, compared with a 5.8 percent increase for others.” (Connecticut State Department of Education, 2015a, p. 5)
Discipline Levels
ELL students tend to suffer high levels of expulsion or suspension. For example, in “the 2013–14 school year, the suspension/expulsion rate was higher for ELs than for all students (10.6 percent versus 7.5 percent), meaning that a higher percentage of all ELs received at least one of these sanctions than all students” (Connecticut State Department of Education, 2015a, p. 7). This seemed to correlate with progress made in English Language proficiency. “Only 37.2 percent of ELs who were either suspended or expelled demonstrated progress in English language acquisition compared with 59.4 percent for all ELs (Connecticut State Department of Education, 2015a, p. 8).
Where are they?
Connecticut state had 34,833 ELLs in 173 public local educational agencies (LEAs) in the 2014-2015 school year. Most of ELLs are in Education Reform Alliance Districts. [ref] “Education Reform Alliance Districts are Connecticut’s 30 lowest-performing districts. The Alliance District program is a unique and targeted investment in these districts to dramatically increase student outcomes and close achievement gaps by pursuing bold and innovative reforms.” (Connecticut State Department of Education, 2017a) [ref]
(Connecticut State Department of Education, 2015a). Over 60 percent of all ELLs were in grades K-5, but in the last four years, the largest numeric growth has been in high school with 1,109 students. 79.8 percent have been in Spanish and 8.6 have been in Arabic (Connecticut State Department of Education, 2015a, pg. 3).
Are they going to school?
It has been proven that absenteeism has detrimental effects on the academic performance of students and their high school graduation rates (Balfanz & Byrnes, 2012). It is particularly disheartening to know that the ELL student body in the 2013-2014 school year showed to have higher rates of chronic absenteeism than English speakers (Gopalakrishnan, 2014).

(Gopalakrishnan, 2014, p. 9).
It is clear to see in this table that not only are ELLs more likely to be impacted by chronic absenteeism, but the other identities that heavily overlap with the ELL category are also disproportionately affected by this phenomenon. In other words, most ELLs tend to have hispanic heritage and this is the race/ethnicity, most affected by chronic absenteeism. ELLs overwhelmingly benefit from free meals, and that is the group of students who are more likely to suffer from chronic absenteeism. Although most ELL in the state of Connecticut can be found in ≤5th grade, according to the Connecticut State Department of Education, “in the last four years [2011-2015], the largest numeric increase in ELs occurred in high school” (Connecticut State Department of Education, 2015a, p. 4). This already marginalized community is more likely to be a victim of chronic absenteeism if the children are in high school–which can be the case for many immigrants.
How are they doing in school?
The arrival of new technology allows states to clearly look at how well a particular student understands the subject matter regardless of whether or not he/she/they is proficient in English. Unfortunately, we are still not seeing the desired outcomes in ELLs. One of the few good things that the passage of the No Child Left behind law created was the annual tracking of deserving students (e.g. students of color and ELLs) to make sure that districts could not ignore these neglected communities. During the NCLB era, ELLs students heavily underperformed when compared to their English-speaking counterparts (Connecticut State Department of Education, 2015a). In 2015, schools had the opportunity to use the Smarter Balanced Assessment (SAB) and little changed. This test allows Math exams to be taken in Spanish or provides directions in a variety of languages (Smarter Balanced: Assessment Consortium, 2016). These accommodations, however, had little effect on improving the scores of ELLs. The CSDE released the SAB test scores of the 2014-2015 and 2015-2016 school years for English Language Arts (ELA) and Math [ref] Children continue to use the Connecticut Mastery Test (CMT: grades 3–9) and the Connecticut Academic Performance Test (CAPT: grades 10–12) for science (Cheshire Public Schools, 2017). [ref] (Connecticut State Department of Education, 2016c).


Although all subgroups seemed to improve, it is no time for celebration. ELL students in Connecticut are the subgroup with the lowest performance even with exams in their language.
Furthermore, “Connecticut students who learn English as a second language drop out of high school at a rate higher than any other New England state, according to an analysis by the New England Secondary School Consortium” (Desroches, 2015).
Teacher Shortage: Where are the (Qualified) Teachers?
Connecticut has struggled to find and retain qualified teachers for ELL programs since 2004. One of the biggest problems is that teachers cannot simply move from one state to another and start teaching. The certification requirements could be very different, deterring qualified teachers from moving into the state. Also, bilingual certification is still considered a “secondary” certification. This means that teachers must first get a regular teacher certification and then choose to take more courses and become a bilingual teacher (Sanchez, 2015). Currently, Connecticut’s bilingual programs cannot seem to find qualified teachers.

[ref] “Applicant pool ratings: 1) Few or minimally qualified applicants; 2) Some acceptable applicants; 3) Many acceptable applicants; 4) Some high-quality applicants; 5) Many high-quality applicants” (Connecticut State Department of Education, 2015b. p. 6). [ref]
“The CSDE Bureau of Data Collection, Research and Evaluation and the Bureau of Educator Standards and certification collaborated to develop a methodology to identify teacher shortage areas.” These factors included the number of people renewing or receiving CT certificates, how many long-term substitutes (serving for longer than 40 days) were in each field, the median number of credentialed applicants per available position, and how many minimally qualified hires had to be done, and how many positions the schools were unable to fill with qualified applicants (Connecticut State Department of Education, 2015b. p. 7).
In 2015, the state passed a bill that attempted to address this shortage. The bill mandates the state to create or join an interstate agreement so as to reduce the years of experience that out-of-state teachers need to be certified (two years and not three). Applicants in shortage areas (like in ELL education) receive a 90-day temporary teacher certificate. The state budget allocated $3 million dollars for bilingual education for the 2015-2016 school year. ($1.1 Million more than 2014-2015). The budget was expected to increase to $3.5 million in 2016-2017 (Rigg, 2015). Unfortunately, the final budget was $3.16 million.
It is facing all of these obstacles that ELLs are expected to go to school and be hopeful about their future in this education system. In the following section I explain some of the strategies that the CSDE must employ to guarantee a rigorous and promising education to these children.
Policy Alternatives/Recommendations:
Teacher Shortage: A lot of the scholarship urges the state to create collaborate with other states and to develop a certification process that allows teachers to move easily from state to state. As tempting as this option sounds it does not address the fact that the entire country is suffering a shortage of qualified bilingual teachers (Camera, 2015). To encourage people to go into bilingual education, we must make the certification process worthwhile. While we might still keep bilingual certification as a secondary path, we can allow teachers who choose to become bilingual teachers to have loan forgiveness for their regular certification program if they choose to receive it from one of the Approved Educator Preparation Programs in the state (Connecticut State Department of Education, 2016a). Hopefully this allows teachers of color who might not have the means to put themselves through college to become bilingual teachers and to teach in communities that look like them. It has been extensively proven that teachers of color can have higher expectations from their students. They could help their students with “cultural shock” given that many ELL students tend to be immigrants or children of immigrants. This could also help increase the retention of teachers in this field (Summerhill, 2016).
Connecticut currently allows people Teach for America to teach bilingual classes and it also allows the Area Cooperative Educational Services (ACES) to offer Alternate Route to Certification for Teachers of English Language Learners (ARCTELL). This program is only a few months long. It costs $4,800.00 plus $75.00 (application). This program does not offer financial aid because it does not participate in Federal student aid programs (Area Cooperative Educational Services, 2017). We should invest in financial aid and make this program as accessible as possible while keeping in mind that this is not a great solution. If the state invests in this program, it should do so carefully.
Timeline of ELL Education: The English Language Acquisition and Educational Equity Work Group (formed by the Connecticut General Assembly) released a report in 2015 with recommendations to improve Bilingual Education in the state. The group concluded that ELLs must have access to 60 and not only 30 months of bilingual instruction and that to make this shift, the state must collaborate with institutions of higher education to develop adequate standards. They emphasized the importance of including the culture of the children into instruction and to include the families of the students as much as possible (Candelaria & Roldán, 2015). While I agree with these recommendations, I must also emphasize the importance of having an Bilingual program for children who arrive at to United States while they are in high school and cannot take full advantage of the extended period of time. I see this being a challenging program to implement, however, as a state, we cannot guarantee that when these kids graduate that they will be able to go to college or find a good job if they have not mastered the language. It is our duty to make sure that that they have a chance to have a good life.
I see this program being smaller, so the students may come from high schools across the same city. We could hire extra bilingual teachers, especially those who get their certification through alternative programs, so they can have more practice.
Dual Language Bilingual Education Program: In the “background:” section of this Policy memo, I introduced the different ways in which “bilingual education” takes place in the state of Connecticut. Dual Language Bilingual Education programs have long been revered as the golden model to teach bilingual education that benefits all students. This program, however, is recommended at a very young age. It requires a minimum of 4 to 6 year of bilingual instruction, so researchers advocate for a program that starts in the first grade. 50% of the instruction must be in English. There must at least be a 50:50 ratio of only-English-speakers and ELLs in the classroom. This strategy definitely needs well prepared teachers. So it might be hard to implement in the current shortage crisis. The teacher must be able to foster positive interactions among students (Candelaria & Roldán, 2015). Given that the majority of ELLs in the state of Connecticut live in cities like Hartford, New Haven and Bridgeport (Connecticut State Department of Education, 2012), these programs must start here with Spanish/English. They could give an advantage to only-English speaking children in these cities to have access to a new language. It could also help ELLs integrate into a new culture and to share theirs more easily.
English Learners page on the CSDE website: In the course of this Policy memo, I visited the English Learners page on the CSDE website many times (http://www.sde.ct.gov/sde/cwp/view.asp?a=2618&q=320848). The website lists a variety of sources but most of them seem to be catered for policy makers, teachers and administrators. These are very important to have, however, a ELL student or much less his non-English speaking family would be able to navigate this website. This limits the agency that these communities could exert over the kind of bilingual education that their kids could get. It keeps them from being advocates and from feeling welcomed in this state. This is particularly important because “parent permission is necessary to enter a student into or to continue a student in ESL/bilingual education services and program and to refuse or remove a student from ESL/Bilingual Education services and programs” (Connecticut State Department of Education, 2015c). We must make sure that all the websites in Education Reform Alliance Districts’ Schools can be translated to the native languages of the ELLs students in that district.
Going to College: The English Learners site on the CSDE website makes no mention of the college path for ELLs. It makes no mention of the Test of English as a Foreign Language (TOEFL). Given that many ELLs might be immigrants, knowing about the TOEFL might be important if they are considering college. It is a very expensive test ($190.00 in the United States). You only need a high school diploma to take it and universities like Yale accept it as long as the taker is “not a native English-speaker and [has] not taken at least two years of secondary education where English is the medium of instruction, Yale strongly recommends that [he/she/they] take any one of the proficiency tests listed below [among them TOEFL] (Yale University, 2017). These kinds of opportunities could change how teachers, schools and districts as a whole see English Learners. They should aspire to go to college and if they get to the United States as a junior in High School, the state must do all it can to grant them a chance to see those dreams come true. According to the New England Secondary School Consortium, in 2013 English Language learners had lower college persistence than their non-ELL counterparts (74.9% as opposed to 87.2%) (Desroches, 2015).
Conclusion:
Education has never been an easy problem to solve but as citizens who aspire to see a democratic country, we must do our best to reach this ideal. We have been short on this promise when it comes to ELLs. Throughout this Policy Memo I attempted to highlight the many obstacles that these children face in our state of Connecticut. Many of them came to the country and must face what it means to be away from home and craft your own in a new place. They also suffer from poverty, academic challenges, unqualified members of staff, etc. These factors sometimes mount to low graduation rates, suspensions, expulsions, low-college attendances, that simply replicate the cycles of poverty that put them there in the first place. I hope that my contributions in this policy memo not only express how disappointed I am with the state of Connecticut for failing so many children and families, but that I also offer possible solutions to these problems. I hope I empowered not only more teachers to go into bilingual education, but I hope I emphasized the importance of having teachers of color in bilingual classrooms as opposed to only more bilingual teachers. I hope I moved away the popular narrative that blames the state for failing to graduate students who can master the English language and that instead, I raised the expectations we must have for these children. We must put more resources into getting these students to college; we must include their families in the discussion of their education and assure them that that not speaking English could be an asset to the state and our country and not a setback.
References
Area Cooperative Educational Services. (2017). Alternate Route to Certification for Teachers of English Language Learners. Retrieve from http://www.aces.org/professional-development/arctell
Balfanz, R., & Byrnes, V. (2012). Chronic Absenteeism: Summarizing What We Know From Nationally Available Data. Baltimore: Johns Hopkins University Center for Social Organization of Schools. Retrieved from http://new.every1graduates.org/wp-content/uploads/2012/05/FINALChronicAbsenteeismReport_May16.pdf
Camera, Lauren. (2015). “Wanted: bilingual Teachers: More than 5 million students in the public school system are English Language Learners.” USNEWS. Retrived from https://www.usnews.com/news/articles/2015/10/16/us-faces-shortage-of-bilingual-teachers
Candelaria J. & Roldán K. (2015). “English Language Acquisition and Educational Equity Work Group Report to the Speaker of the House the Honorable Brendan Sharkey.” Connecticut General Assembly. Retrieved from http://www.hfpg.org/files/8614/3707/1741/ELAEE-report-0324151.pdf
Casolino, P. (2016). “2017 CT State Budget: Department-By-Department Breakdown.” Hartford Courant. Retrieved from http://www.courant.com/politics/hc-2017-ct-state-budget-list-htmlstory.html
Cheshire Public Schools. (2017). SMARTER Balanced Assessment Consortium (SBAC); CMT/CAPT Science; and Common Core State Standards (CCSS) Information. Retrieved from: http://www.cheshire.k12.ct.us/district-departments/curriculum–instruction/smarter-balanced-assessment-consortium-(sbac)-cmtcapt-science-and-common-core-state-standards-(ccss)-information
Connecticut State Department of Education. (2010). LEP/ELL Identification Process Guidelines. Retrieved from http://www.sde.ct.gov/sde/LIB/sde/pdf/curriculum/bilingual/LEP_ELL_ID_Guidelines.pdf
Connecticut State Department of Education. (2012). DATA BULLETIN: English Language Learners, School Year 2011-12. Retrieved from http://www.sde.ct.gov/sde/lib/sde/PDF/EvalResearch/ELL_Data_Bulletin_2012.pdf
Connecticut State Department of Education. (2015a) Data Bulletin: Connecticut’s English Learners (Grades K–12), School Year 2014–15. Retrieved from http://www.sde.ct.gov/sde/lib/sde/pdf/evalresearch/el_databulletin_aug2015.pdf
Connecticut State Department of Education. (2015b) Data Bulletin: Public School Hiring Trends and Certification Subject Shortage Areas for 2015–16. Retrieved from http://www.sde.ct.gov/sde/lib/sde/pdf/evalresearch/databulletinoct2015.pdf
Connecticut State Department of Education. (2015c). English Learner Programs and Services in Connecticut Public Schools: A Resource Handbook for Administrators (2nd Edition). Retrieved from http://www.sde.ct.gov/sde/lib/sde/pdf/curriculum/bilingual/el_admin_resource_handbook.pdf
Connecticut State Department of Education. (2016a). “Guide To Approved Educator Preparation Programs In Connecticut.” CONNECTICUT STATE DEPARTMENT OF EDUCATION BUREAU OF EDUCATOR STANDARDS AND CERTIFICATION. Retrieved from http://www.sde.ct.gov/sde/lib/sde/PDF/Cert/guides/ap_ed_prep_prgms.pdf
Connecticut State Department of Education. (2016b). Smarter Balanced Assessment 2015-16 Preliminary Results. Retrieved from http://www.sde.ct.gov/sde/lib/sde/pdf/student_assessment/smarter_balanced/smarter_balanced_2015_16_preliminary_results.pdf
Connecticut State Department of Education. (2016c). State test scores up across the board: Preliminary results of Smarter Balanced tests show improvement in all subjects, grades, and subgroups Many Alliance Districts outpaced statewide improvement in ELA and Math. Retrieved from http://www.sde.ct.gov/sde/lib/sde/pdf/student_assessment/smarter_balanced/smarter_balanced_2015_16_preliminary_results.pdf
Connecticut State Department of Education. (2017a). Alliance Districts. Retrieved from http://www.sde.ct.gov/sde/cwp/view.asp?a=2683&Q=334226
Connecticut State Department of Education. (2017b). Bilingual Education Availability: Statutory Requirements. Retrieved from http://www.sde.ct.gov/sde/cwp/view.asp?a=2618&q=320822
Connecticut State Department of Education. (2017c). English Learners. Retrieved from http://www.sde.ct.gov/sde/cwp/view.asp?a=2618&q=320848
Desroches, D. (2015). “A Quarter of Connecticut’s English-Language Learners Drop Out of High School.” WNPR: Connecticut’s Public Media Source for News and Ideas. Retrieved from http://wnpr.org/post/quarter-connecticuts-english-language-learners-drop-out-high-school
García Garrido. M. I. & Fernández Álvarez, M. (2011). Historical Perspectives of Bilingual Education in The United States. Revista Teoría de la Educación: Educación y Cultura en la Sociedad de la Información. 41-55. Retrieved from http://campus.usal.es/~revistas_trabajo/index.php/revistatesi/article/view/8482/8575
Gopalakrishnan, A. (2014). CHRONIC STUDENT ABSENTEEISM IN CONNECTICUT’S DISTRICTS AND SCHOOLS. State Department of Education: Bureau Chief Performance Office. Retrieved from: http://www.sde.ct.gov/sde/lib/sde/pdf/deps/chronicabsenteeism/learningfromthedata_statepresentation.pdf
Kim, Y., Hutchison L. A., & Winsler, A. (2015). Bilingual education in the United States: an historical overview and examination of two-way immersion. Educational Review, 67, 236–252. http://dx.doi.org/10.1080/00131911.2013.865593
Pema, T. (2017). “TOEFL 2017.” CAREERS360: The Education Hub. retrieved from http://www.studyabroad.careers360.com/toefl-test
Rigg, M. (2015). “Danbury school officials hope new legislation will help attract bilingual teachers.” Newstimes. Retrieved from http://www.newstimes.com/news/article/Danbury-school-officials-hope-new-legislation-6331154.php
San Miguel, G. (2004). Chapter 4: THE FINAL PUSH, 1990S. Contested Policy: The Rise and Fall of Federal Bilingual Education in the United States, 1960-2001 (77-98). Texas: University of North Texas Press. Retrieved from http://muse.jhu.edu/chapter/275641
Sanchez, I. (2015). “Addressing Bilingual Teacher Shortages in Connecticut.” New America. retrieved from https://www.newamerica.org/education-policy/edcentral/addressing-bilingual-teacher-shortages-connecticut/
Smarter Balanced: Assessment Consortium. (2016). Accessibility Resources. Retrieved from https://www.smarterbalanced.org/wp-content/uploads/2015/09/Accessibility-Resources-Comparison.pdf
Summerhill, E. C. (2016). “The Importance of Recruiting and Retaining Teachers of Color in All Schools.” federal Reserve bank of Boston. Retrieved from https://www.bostonfed.org/publications/communities-and-banking/2016/fall/the-importance-of-recruiting-and-retaining-teachers-of-color-in-all-schools.aspx
Taylor, A. B. (2016). Guidelines for Making Decisions About Designated Supports/ Accommodations. Connecticut: State Board of Education: Bureau of Student Assessment- 2016-17. http://www.sde.ct.gov/sde/lib/sde/pdf/student_assessment/special_education/2016-17_Assessment_Guidelines_Final-9-8-16.pdf
U.S. Department of Education. (2016). EVERY STUDENT SUCCEEDS ACT: Accountability, State Plans, and Data Reporting: Summary of Final Regulations. Retrieved from https://www2.ed.gov/policy/elsec/leg/essa/essafactsheet1127.pdf
U.S. Department of Education. (2017). Every Student Succeeds Act. Retrieved from https://www.ed.gov/essa?src=rn
Yale University. (2017). Applying to Yale as an International Student. Retrieved from https://admissions.yale.edu/applying-yale-international-student
How Inclusionary Housing in Sacramento has led to Integration in Neighborhoods and Schools
Introduction:
“The future is here; it’s just not evenly distributed.” That quote from a William Gibson science fiction novel is used widely in Silicon Valley to describe the technology landscape, but it applies to segregation as well. In the United States, schools are more segregated than they have ever have been despite the Brown v. Board of Education decision that outlawed separate schools for all races (Millhiser, 2015). In the U.S., over one-third of black and Latino students go to schools that are over 90% non-white, while more than one-third of white students go to schools that are over 90% white (Potter & Quick, 2016). The increase in segregation stems in large part from racialized housing practices such as redlining, blockbusting, and racial covenants that have led to the segregation of neighborhoods. These discriminatory practices prevented certain people from buying homes in better areas, which determined where people lived, and as a result, led to segregation in schools as well. Neighborhood stratification led to school segregation because school attendance zones were tethered to real estate and busing-based integration efforts have declined so more students go to the school closest to them (Potter & Quick, 2016).
I will focus primarily on the Sacramento, California district and how it has tried to address these discriminatory practices from the 1900s by instituting inclusionary housing policies to fight racial and economic segregation. Sacramento has succeeded, by and large, because it is considered one of the most diverse and integrated cities in the U.S. (Silver, 2015). Time magazine asked The Civil Rights Project to name the most residentially integrated city in the U.S., and they chose Sacramento (Orfield, 2016).
I will explain how housing discrimination caused segregation in neighborhoods and in schools and how Sacramento’s commitment to creating more affordable housing has had a positive effect in Sacramento on not only its neighborhoods but on the schools as well. By focusing on getting rid of neighborhood segregation, Sacramento has also succeeded in increasing the diversity in schools. In California, Sacramento has the most integrated large public school districts (Orfield, 2016).
While other research has examined how integrated Sacramento is as a city, this report is unique because it ties Sacramento’s focus on desegregating neighborhoods with desegregation in schools. Also, this report will examine the racial demographics in Sacramento public schools and the surrounding county in context with other cities to show how its diversity in neighborhoods is carrying over to the schools and how Sacramento can be an example.
Sacramento may turn out to be the future for school inclusion, once that future gets a bit more widely distributed.
Background
Housing Discrimination
Throughout the 1900s, the U.S. government, realtors, and banks conspired against minorities in a multitude of ways to prevent them from living in certain areas. One example of this is redlining, where banks disproportionately denied black people loans and mortgages so that they couldn’t afford to buy a home. Neighborhoods where black people lived were colored in red and were deemed ineligible for support for the Federal Housing Administration. An example of Chicago in 1939 where an entire area was considered to be minority housing is shown below. Blacks were denied services because of raising prices and because people wanted to maintain the current ethnic composition of the area that would be primarily white (Coates, 2014).

Another practice was blockbusting, where realtors would essentially encourage “white flight.” They would sell a home to a black person in an area and then encourage the white people in the area to move. The realtor would buy it from a white family for a relatively low price and then would charge much more than market rate when selling to a black person, because they may not have had any other options (Coates, 2014). The final discriminatory housing practice that I’ll mention (though there are many more), is racial covenants. This was a legal way to prevent blacks from living in an area, because neighborhoods could band together and prevent blacks from moving into the neighborhood by agreeing not ever sell their home to a black person. For example, by 1940 in Chicago and Los Angeles, 80% of properties had racial covenants (Fair Housing Center, 2010).
Neighborhood Segregation Effects
These methods to prevent blacks from living in white neighborhoods resulted in the segregation of neighborhoods that have had crippling effects for minorities in the U.S, such as increased poverty, poorer health, and higher exposure to violent crime (Bethea 2013). One of the main effects of neighborhood segregation is the segregation of schools. School districts lines tend to be drawn to reflect the neighborhoods and can be segregated by race, as transportation from one school district to another is costly and not time-efficient. Segregated schools tend to lead to better schools for white students and often impoverished schools that don’t have the same resources for minorities (Walsemann, 2010). There have also been shown to be many benefits of racially integrated schools such as obviously allowing minorities to get the same opportunities as white students but also to socialize students and prepare them for a diverse workforce where employers value people who can work with others from diverse cultural backgrounds (Stuart, 2016). In addition, a report found that, “researchers have documented that students’ exposure to other students who are different from themselves and the novel ideas and challenges that such exposure brings leads to improved cognitive skills, including critical thinking and problem solving.” To be sure, there are some drawbacks about promoting the integration of schools, such as the fact that the onus is often placed on minority students and their families to be the ones doing the integrating, and they often have to leave the comfort of their own schools to go to a new school with new people. But, promoting neighborhood integration means that minority students won’t have to travel a long ways to get to a quality school – instead, their neighborhood school will be diverse and likely of better quality.
History in Sacramento
Sacramento, California is one of the cities in the U.S. that is actively trying to address segregated neighborhoods by introducing an inclusionary housing policy. Sacramento passed the Mixed-Income Housing Ordinance in 2000 that applied to all residential developments over nine units in “new growth areas” (Brunick, 2004). The ordinance requires that 15% of all units by affordable housing. The goal is to fight racial and economic segregation by allowing mid-to-low income families to purchase homes in a multitude of areas.
This inclusionary housing policy in Sacramento has contributed to Sacramento becoming one of the most diverse and integrated cities in the U.S, and other large cities could follow their model (Silver, 2015). Sacramento was considered the third most diverse city in the U.S. from a citywide level, the most diverse city from a neighborhood level, and the second most diverse city from an integration standpoint, as shown in the graph below (Silver, 2015).

This graph is from FiveThirtyEight. Sacramento is in the top-right quadrant, which means it has high neighborhood and citywide diversity scores – Sacramento is both diverse and integrated.
Inclusionary Housing in Sacramento
Sacramento decided to adopt an inclusionary housing ordinance in large part because of the affordable housing crisis and to counteract the legal discriminatory practices from the 1900s. In the late 1900s, house prices skyrocketed, as “the cost of a new home nearly tripled and the cost of an existing home nearly doubled” because of high demand for homes, scarcity of available land, and a low supply of houses (Padilla, 1995). The average sales prices of homes increased at a faster rate than the average family income did; from 1994-2003, the average family income increased by 44.6%, but the average sales price of a home increased by 101.5% (Basolo & Scally, 2008).
Sacramento adopted the Mixed-Income Housing Ordinance on October 3, 2000. The main aspect is that it required 15% of new housing projects to be affordable housing for lower-income families. Some other aspects of the ordinance are: it applies to residential projects of 10 or more dwellings, 5% must be low income units and 10% must be very low income unites, developments of 50% or more of inclusionary housing can’t be located next to one another, and the design of inclusionary units needs to be compatible with the other units (Sacramento City Council, 2015).
The idea behind inclusionary housing in Sacramento is that by having more mixed-income and diverse communities, lower-income workers can own a home near where their jobs are, and their kids can live near good, quality schools that have a history of performing well academically (Garvin, 2015). In this way, low-income families can afford houses in already very good neighborhoods, which will build equity over time.
The Need for Inclusionary Housing
The outright housing discrimination in the U.S.that led to neighborhood inequality was banned by the Fair Housing Act of 1968 that addressed issues of, for example, redlining, blockbusting, and forming racial covenants. It deemed these practices to be unconstitutional and tried to make sure the buyer or renter could get access to affordable housing (U.S. Department of Justice, 2015). While these practices were made illegal, the damage had been done, and neighborhoods have remained segregated since then. There have been very few policy efforts to address the segregation problem in the U.S., as “housing policy in the United States appears to be in a protracted, transformative period that combines a lack of strong federal leadership with continued reliance on increasingly uncertain federal funding” (Basolo and Scally, 2008). This may be the case because many politicians are uncomfortable talking about race and don’t want to acknowledge the rampant inequality in neighborhoods around the country.
As stated in a UCLA report on segregation in California, “Housing segregation is a root cause of school segregation. Any long-term policy to foster increased and lasting school integration must determine how to enforce fair housing and affordable housing policies more effectively” (Orfield, 2014).
Inclusionary Housing in Sacramento and its School Districts
We can see the benefits of inclusionary housing with the effects that it has had on the neighborhoods in Sacramento, because of how integrated Sacramento is as a city. Show below is a graph (using this tool) of the downtown Sacramento area, where each dot represents an ethnicity. A blue dot is white, a green dot is black, a red dot is asian, and an orange dot is hispanic. The darker the dot, the more concentrated a certain population is in that area. While there are certain areas that seem to be primarily one race, such as the red section in the middle, the city as a whole appears very diverse. In fact, Sacramento is the most integrated major city in the U.S. (Silver, 2015). It’s a city where every race is in the minority. Sacramento County is 12.7 percent Black, 13.5% Asian, 30.7% Hispanic, 32.4% White, and 10.3% other.

Data Analysis
The desegregated neighborhoods have had the effect of making the Sacramento City Unified School District (SCUSD) one of the most diverse and desegregated in the U.S in terms of the wide range of students they serve (Rutherford, 2013). The SCUSD is made up of public schools in the area and serves 36.5% Hispanic students, 18.6% white students, 19.1% Asian students, 18% black students, and 5.3% multiracial students (Rutherford, 2013). These numbers show the wide range of students who attend public schools in Sacramento. The one caveat is that the Hispanic population is somewhat overrepresented in the public schools, and the white population is somewhat underrepresented, which is shown in the graphs below.


Even though there is a difference (15.9%) in the percentage of white students who attend the Sacramento public schools (18.6%) and the white percentage of the population (34.5), it is much smaller than in other major cities. This may be a result of Sacramento’s focus on a move toward integrating neighborhoods.
Below, I look at two other cities (Chicago and Baltimore) to show how the disparity between the percentage of white students in public schools versus the percentage of white people in the population in Sacramento is much less than these three cities that have fairly high levels of neighborhood segregation. The population numbers of Sacramento, Chicago, and Baltimore are from the 2010 U.S. Census.
Chicago:

As seen in the map, the neighborhoods in Chicago are very segregated. And, the percentage of white students who attend the public schools in Chicago is much less than the white makeup of the city as a whole. Shown below are two pie charts that show the difference (CPS).


This shows that the number of white students in Chicago (9.9%) is disproportionately low to the number of white people in Chicago (39%). The reason for the disparity in white students in the public schools may because because of the segregated nature of the neighborhoods and schools in Chicago.
Baltimore:

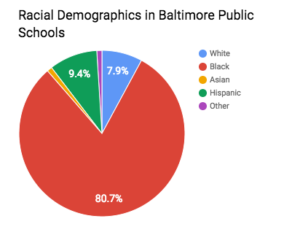

Again, Baltimore is shown above to be a very segregated city. And, the number of white students in Baltimore (7.9%) is disproportionately low to the number of white people in Baltimore (962%).
This effect is also seen somewhat in Sacramento but to a much lesser extent, which shows that Sacramento may be on the right path with the inclusionary housing policy.
Benefits of Integration in Schools
In Sacramento, the fact that the neighborhoods and schools are very desegregated has positive effects for the school and for the students. Diversity in Sacramento schools has cognitive, social, and emotional benefits for students, because the students get a chance to interact with a multitude of people from a variety of backgrounds (Wells, 2016). Diversity in schools also has purported benefits in the workforce, as one study found that 96% of major employers say that it’s important for employees to be “comfortable working with colleagues, customers, and/or clients from diverse cultural backgrounds” (Wells, 2016). Diversity in schools allows students to interact with people of different backgrounds, which will help prepare them socially for the future.
Effects of Desegregation in Sacramento Schools
It is hard to know what exactly the benefits of integration have been so far, since the inclusionary housing policy has only been in place since 2000. But, there are still some signs that the Sacramento City School District is improving – student test scores moved up substantially on the state’s Academic Performance Index (API) from 2011-2012 (SCUSD, 2012). English Language Learners, in particular, has the greatest improvement as a demographic by moving up 15 points in API to above the state average for ELL students. These are just a couple example of improvements in Sacramento schools. It will be important to follow the progress in Sacramento over the next couple of decades to see how the schools fare academically and socially to see if the neighborhood effects of desegregation can carry over to the schools.
Conclusion
One potential solution for integrated neighborhoods is the inclusionary housing policies that have been voluntarily adopted more and more by cities in California. They are needed because of the rising housing costs in the U.S. that are making it harder for impoverished families to buy good houses in good areas. The main purported benefit of inclusionary housing policies has been to make neighborhoods more diverse both economically and racially (Basolo & Scally, 2010). To be sure, there have also been potential negative effects of inclusionary housing such as the supply of homes may go down because the developers may lose incentive to build and construction activity would be reduced and then affordable houses wouldn’t be built. But, there has been no empirical data to show that this is the case.
Overall, inclusionary housing policies in Sacramento have had the effect of making Sacramento one of the most integrated cities in the U.S. The change has been recent, so it is hard to know for certain whether or not the effect will carry over fully to schools. But, there has been some positive changes in the Sacramento school district schools that signifies that focusing on housing policies may be the solution.
The inclusionary housing model has been successful in Sacramento and can be expanded and applied to many more large cities around the U.S. We need more people to be aware of the segregation problem in neighborhoods and in schools in order to fix the rampant problem. With awareness comes more ideas for solutions, and we can start with inclusionary housing practices. By looking at the example in Sacramento, we can make this desegregated and integrated future real everywhere across the United States.
Works Cited
Basolo, V., & Scally C. (2008). State innovations in affordable housing policy: Lessons from California and New Jersey, Housing Policy Debate, 19:4, 741-774
Bethea, B. J. (2013, November 6). Effects of segregation negatively impact health | The Source | Washington University in St. Louis. Retrieved May 03, 2017, from https://source.wustl.edu/2013/11/effects-of-segregation-negatively-impact-health/
Brunick, N. (2004). Inclusionary Housing: Proven Success in Large Cities. Zoning Practice: American Planning Association, (10).
City Schools at a Glance. (n.d.). Retrieved May 03, 2017, from http://www.baltimorecityschools.org/about/by_the_numbers
Coates, T. (2014, June). The Case for Reparations. Retrieved May 03, 2017, from https://www.theatlantic.com/magazine/archive/2014/06/the-case-for-reparations/361631/
CPS Stats and Facts . (n.d.). Retrieved May 03, 2017, from http://cps.edu/About_CPS/At-a-glance/Pages/Stats_and_facts.aspx
Garvin, C. (2015, July 23). ‘Segregation’ will happen if the city of Sacramento ditches inclusionary housing – Bites – Opinions – July 23, 2015. Retrieved May 03, 2017, from https://www.newsreview.com/sacramento/segregation-039-will-happen-if/content?oid=17653788
Millhiser, I. (2015, August 13). American Schools Are More Segregated Now Than They Were In 1968, And The Supreme Court Doesn’t Care, from https://thinkprogress.org/american-schools-are-more-segregated-now-than-they-were-in-1968-and-the-supreme-court-doesnt-care-cc7abbf6651c
Padilla, L. (1995). Reflections on Inclusionary Housing and Renewed Look at its Viability. Hofstra Law Review 23(3), 539-626.
Potter, H., Quick, K., & Davies, E. (2016). A New Wave of School Integration: Districts and Charters Pursuing Socioeconomic Diversity. The Century Foundation. Retrieved from tcf.org.
Orfield, G., & EE, J. (2014). Segregating California’s Future: Inequality and Its Alternative 60 Years after Brown v. Board of Education. The Civil Rights Project.
S. (2015, September 1). AN ORDINANCE REPEALING CHAPTER 17.712 OF, AND ADDING CHAPTER 17.712 AND SECTION 17.808.260 TO, THE SACRAMENTO CITY CODE, RELATING TO MIXED INCOME HOUSING . Retrieved from http://www.qcode.us/codes/sacramento/revisions/2015-0029.pdf
Sacramento City Unified School District. (2012, October 16). Retrieved May 03, 2017, from http://www.scusd.edu/e-connections-post/scusd-student-test-scores-are-rise
Silver, N. (2015, May 1). The Most Diverse Cities Are Often The Most Segregated, from https://fivethirtyeight.com/features/the-most-diverse-cities-are-often-the-most-segregated/
Stuart Wells, A., Fox, L., & Codova-Cobo, D. (2016, February 09). How Racially Diverse Schools and Classrooms Can Benefit All Students. Retrieved May 03, 2017, from https://tcf.org/content/report/how-racially-diverse-schools-and-classrooms-can-benefit-all-students/
U. (2015, August 6). Fair Housing Act. Retrieved May 03, 2017, from https://www.justice.gov/crt/fair-housing-act-2
U. (n.d.). United States Census: Quick Facts. Retrieved from https://www.census.gov/quickfacts
T. (2010). 1920s–1948: Racially Restrictive Covenants. Retrieved May 03, 2017, from http://www.bostonfairhousing.org/timeline/1920s1948-Restrictive-Covenants.html
Walsemann, K. M., & Bell, B. A. (2010). Integrated Schools, Segregated Curriculum: Effects of Within-School Segregation on Adolescent Health Behaviors and Educational Aspirations. American Journal of Public Health, 100(9), 1687–1695. http://doi.org/10.2105/AJPH.2009.179424
The Liminal Presence of Arabic in American Public Schools
Executive Summary
In American schools, Arabic is not a widely taught language; one would be hard-pressed to find schools that offer the language, especially into the more advanced levels. However, despite Arabic’s rarity, schools exist from across the spectrum that offer it, sometimes in the most unexpected of places. These unique schools span private, magnet, charter, public, and dual-immersion schools, and, while concentrated on the coasts of the U.S., will crop up right in the midst of central, rural America.
Of these American schools that offer Arabic as a foreign language, however, a disproportionate number tends to be private or magnet schools. Schools that serve predominantly privileged students are far more inclined to offer what can be considered a more contentious language than the widely taught Spanish or French languages, or even Chinese. On the other hand, public schools that try to implement the teaching of the Arabic language more often than not become mired in controversy and source of controversy themselves.
In light of this phenomena, as well as a multitude of reasons relating to the utility of exposure to Arabic that will be later extrapolated more in-depth, there should be a future push to further include the Arabic language within foreign language study at public schools, and ideally in public schools in rural and potentially more intolerant places, given the recent rise of a fiercely nativist and xenophobic attitude towards immigrants and especially Islam-practicing people, many of who originate or whose families originate from Arabic-speaking countries. Specifically, large cities should make policies that create and protect Arabic language programs for public schools in order to increase the accessibility of the language and stymie prevalent prejudices.
Introduction
The Arabic language is the fifth most spoken language in the world, with an estimated 250 million native speakers (Lane). Yet, as prolific and widely spoken as Arabic is, it is all but unheard of in the choices of foreign languages given to American students across the country. In comparison, the Chinese and Spanish languages (the first and second most spoken, respectively) abound in classrooms, along with French, which does not even make the top ten most spoken languages. In fact, when there are 250 million native speakers of Arabic, it seems almost anachronistic to teach French at the scale that it is currently taught in American schools.
Moreover, Arabic is also the fastest growing language in the U.S. In fact, according to a Pew Research Center report, the number of Arabic-speaking people ages 5 or older grew by 29% from 2010 to 2014 to a total of 1.1 million speakers in the U.S., although advocacy groups like the Arab American Institute place an estimate at about 3.7 million Arab people in the U.S. with ability in the Arabic language (Brown 2016; Demographics).
 Source: Pew Research Center

The data above shows the number of students enrolled in foreign language programs at American universities. Arabic is one of the fastest growing languages in speakers and popularity in the US. Source: Modern Language Association
Despite the magnitude of Arabic speakers and its rapid increase in the U.S., it is not a popular foreign language to be taught in American schools. This even extends to the realm of higher education; according to the Modern Language Association of America, in 2013, Arabic had one of the lowest percentages of enrollments in advanced levels in United States institutions of higher education, on par with American Sign Language and Latin (Goldberg et al. 2015). But unlike higher education institutions, the availability of learning the Arabic language is limited or nonexistent for American students below the age of eighteen. However, some precedents do exist.
Background
In American schools at large, there exists a very obvious trend to the teaching of Arabic. In 2009, there were approximately 220 private and private charter schools in the U.S. teaching Arabic, in comparison to only approximately 93 public and public charter schools(Schools Directory). Indeed, while public schools have yet to strongly introduce Arabic into their curricula, several private schools have already established strong Arabic programs. For instance, according to the website of Friends Seminary in New York City, the school offers five levels of Arabic study, culminating in a class taught in full Arabic (World Languages: Ancient and Modern). The language there is becoming a more popular choice among students since being introduced in 2008, and even incorporates some Arab pop culture that the students would likely otherwise go unexposed to (Dominus 2010). Similarly, schools such as the all-male private Brunswick School in Greenwich, Connecticut and the private Choate Rosemary Hall in Wallingford also offer Arabic to their students (Holtz 2006). Several magnet schools also offer Arabic, such as the Metropolitan Business High School in New Haven and the Center for Global Studies in Norwalk, at least in the fall of 2006 (Holtz 2006). However, as it will be later mentioned, Arabic programs are prone to obstacles and failure, especially outside the private realm. But as for Arabic programs in public schools, the precedents are as varied as they come.
At the selective end of the scale is elite public high school Stuyvesant in New York City, where a student-organized push for Arabic in 2004 led to the language being offered alongside a multitude of other less commonly taught languages (Bahrampour 2004). But even at Stuyvesant, there were obstacles in introducing Arabic as an elective: it took the school’s Muslim Student Association three years and a lot of fundraising to put the idea into motion, even after comparably uncommon but arguably less pertinent languages like German, Japanese, Hebrew, and Korean had long been offered. (Levin 2005). But if the obstacles of getting Arabic into Stuyvesant were tough, the challenges other public schools have faced are more or less insurmountable.
At the forefront of public schools embroiled in the battle to instruct Arabic is a public school in Brooklyn called the Khalil Gibran International Academy. A small public school that was founded in part by the New Visions for Public Schools organization in New York City, its mission to “develop, maintain, and graduate life-long learners who have a deep understanding of different cultural perspectives, a love of learning and a desire for excellence with integrity” was brought to a halt by backlash (About Our School).

A 2007 protest in favor of Khalil Gibran International Academy. Source: In These Times
Expected to be an Arabic-English dual-language program and a promising start for instruction in the Arabic language, the school in its infancy of the spring of 2007 began to feel the wrath of bigots and critics alike. Only months after plans for the school were announced, vocal administrators and parents at neighboring school PS 282 in Park Slope, the originally planned area for the school, forced KGIA to move to a new location (Bosman & Medina 2007). Even Diane Ravitch “questioned why the city should have specialized language and cultural schools at all”. But the most vicious attacks would come from a now-defunct neoconservative newspaper called the New York Sun which published an op-ed by Daniel Pipes, a director of a right-wing neoconservative think tank and vehement enemy to Arabic instruction (Wessler 2009). Calling the school a “madrassa”, an Arabic word for a school that has connotations with Islamist extremism, Pipes said of the school, “Arabic-language instruction is inevitably laden with…Islamist baggage”. Not soon afterwards, a group formed called the Stop the Madrassa Community Coalition sprang up and also began to attack Khalil Gibran Academy and its founding principal, Debbie Almontaser, who was eventually forced to resign due to an incident involving a t-shirt reading “Intifada NYC” (intifada being an Arabic word associated with Palestinian uprisings against Israeli occupation of the West Bank and Gaza), despite the t-shirt not relating to the school in the slightest. Due to the ruthless attacks of Pipes and Stop the Madrassa, Almontaser was forced to resign from the school she helped to found and enrollment at the new school plummeted.
Consequently, the discussion on Middle Eastern culture and history as well as instruction in Arabic was significantly cut back on in class, with teachers going so far as to cut pictures of mosques out of textbooks in fear of retribution. A former student of the school is quoted as saying, “I know there are so many people being racist against the school. I don’t read the articles, but everyone is against learning Arabic as a second language”. On the current site for the Khalil Gibran International Academy, the only mention of Arabic instruction anywhere on the website is one sentence at the end of information page: “Through our English and Arabic language program, students graduate with the bilingual and bi-literate skills needed for multicultural contexts” (About Our School). Nowhere else is it found.
Similar to this experience was an effort to implement a language programs for Arabic in public schools in San Francisco. In an interview with Lara Kiswani, the executive director of Arab Resource & Organizing Center in San Francisco and leader of the effort, parallels are in fact made with the plight and virtual failure of Khalil Gibran in the face of racism and xenophobia. However, in San Francisco, the implementation of the Arabic program has yet to get off the ground, since the process has nearly constantly been stalled by a wealthy, private, pro-Israel institution called Jewish Community Relations Council that seeks to attack and marginalize anything it perceives to be critical of Israel (Sokolower 2017). On top of this obstacle, there has been some opposition to the program, along with the implementation of a Vietnamese language program, among the teaching staff of the schools to be affected by the implementation; they sent petitions to the district saying that they did not want to attract more Arab or Vietnamese families and change the demographics of their schools.
Comparable attacks can be seen elsewhere. The Glenn Beck-founded conservative platform The Blaze levelled criticism at the New York City public elementary school PS 368 after it was announced that the principal planned to introduce Arabic instruction requirement for all grades in order to boost the school’s standing and enrich the students’ education. Says the author, “Rather than focusing on more common (some would argue even more useful) languages like French or Spanish, [the principal] has chosen Arabic in an effort to achieve an International Baccalaureate, which would apparently be a wonderful sentiment for the school’s reputation” (Hallowell 2012). As a reminder, Arabic is the fifth most spoken language worldwide.
Data & Proposal
And yet amid all of criticism and protest leveraged against the Arabic language being taught in public schools, there have been instances of success. Although not a program in a public school, the High School Cooperative Language Program at Yale University has offered classes in Arabic to New Haven high school students for twenty years (Holtz 2006). And while the program does have a tuition, it specifically gives students in the New Haven public school system the chance to learn uncommon languages, Arabic among them, for free (Zorthian 2013). In Northern Virginia, amid rising SAT scores and graduation rates in the same district, elementary schools in Fairfax county will have the option to teach Arabic as a language courtesy of a program called FLES (Foreign Language in Elementary Schools). Specifically, Beech Tree elementary school already introduced the Arabic language into its curriculum (Benton 2007). In Kalona, Iowa, with a population of approximately 2,200, is Kalona Elementary, a public school mainly populated by the children of either Mennonite families or of long-settled German and Czech groups. Due to an acquisition of a federal grant through the Foreign Language Acquisition Program, Kalona Elementary then began teaching Arabic to its students, imparting aspects of Arab culture while scrupulously trying to avoid mention of religion of any sort (Freedman 2008). And though the school has faced some early opposition from the town—questions of why Iowa children should be learning the “language of the enemy”—the program seems successful not only in educating the students in a foreign language but promoting a cultural education rarely seen in American schools.
Then there is the Arabic Immersion Magnet School (AIMS) in Houston, Texas. Despite being a magnet school (although the school considers itself a Houston Independent School District public elementary school), it is still noteworthy in its aspect of Arabic immersion; aside from Khalil Gibran, which has all but moved away from the original dual-language intent, and one of the only of its kind (Our Mission). Although this school also faced protest (“You’re taking little babies here, you’re taking little Pre-K, and you’re not allowing them to participate in the American family by assimilating them”, one of the protestors commented), AIMS seems to be thriving (Isensee 2016).

Source: Houston Press
Beyond the success of previous Arabic language instruction programs, there exists a plethora of reasons to teach public school children Arabic. It listed by the Central Intelligence Agency as a critical language, and is thereby not only sought out by the government, but also may allow learners to more easily get government jobs (CIA Values Language Capabilities Among Employees). In a very broad sense, early language exposure and a multilingual environment may enhance the empathy and effective communication of children, who then carry those skills into adulthood (Fan et al. 2015). And with Arabic, the advantages only multiply, especially in the context of learning about and empathizing with Arabic-speaking cultures which are especially demonized in this day and age, considering the xenophobic platform upon which our current president ran and Executive Order 13769, otherwise known as Protecting the Nation from Foreign Terrorist Entry into the United States (six out of the seven countries included in the immigration ban are Arab countries). In light of this, the U.S. is almost certainly going to be involved, whether via conflict or diplomacy, in the Arab world, and ability in Arabic will only become more pertinent.
And it is these reasons that build up the base of the proposal to push for more Arabic education in public schools, especially beginning in elementary school. In order to put this into motion, the governments of larger coastal cities where the Arab populations are larger should allocate more money for grants to give to elementary schools to specifically begin teaching Arabic, and remain in support of Arabic language programs even in the midst of opposition from xenophobic critics and wealthy, private organizations alike (Demographics). These are the obstacles in particular that led to downfall of the Khalil Gibran International Academy and thwarted the efforts to create the Arabic language pathway in San Francisco; in removing these, implementation of Arabic instruction will likely become much easier. And in the long-term, popularization of the Arabic languages in larger cities may incite further programs in more rural areas of the U.S., with the potential for more Kalona Elementaries to crop up.
Conclusion
The teaching of the Arabic language in American public schools is both highly contentious and incredibly important. In terms of current global events to even simple cultural enrichment and empathy, the ability to speak and understand Arabic is invaluable. And yet, because of near constant protest and pushback, Arabic instruction remains firmly rooted in private and charter schools, accessible mainly to the wealthy and privileged. If policies by large cities such as San Francisco, Los Angeles, Chicago, or New York City were to be made to create and protect public Arabic programs, the aforementioned limited accessibility would come to an end, and perhaps the current tide of xenophobic sentiment towards the Arab world could be convinced to reevaluate its stance.
Acknowledgements
I would like to thank Clare Kambhu for being an awesome TA and Professor Mira Debs for being a wonderful instructor for an extremely important class. Many thanks also to my peer editors Alejandra Corona Ortega and Mariana Suárez-Rebling.
Works Cited
“About Us – Khalil Gibran HS.” 2017. Khalil Gibran High School. Accessed April 29. http://www.khalilgibranhs.org/updates.
“Arabic-K12 Teachers Network – Schools Directory.” 2009. The National Capital Language Resource Center. Accessed April 28. http://www.arabick12.org/schools.html.
Bahrampour, Tara. 2004. “NEIGHBORHOOD REPORT: NEW YORK SCHOOLS; Arabic Is in the News. How About at Stuyvesant?” The New York Times, February 1. http://www.nytimes.com/2004/02/01/nyregion/neighborhood-report-new-york-schools-arabic-about-stuyvesant.html.
Benton, Nicholas F. 2007. “New Chinese, Arabic Language Focus in N. Va Public Schools.” Falls Church News-Press Online. August 29. https://fcnp.com/2007/08/29/new-chinese-arabic-language-focus-in-n-va-public-schools/.
Bosman, Julie, and Jennifer Medina. 2007. “How New Arabic School Aroused Old Rivalries.” The New York Times, August 15. http://www.nytimes.com/2007/08/15/education/15school.html.
Brown, Anna. 2016. “The Challenges of Translating the U.S. Census Questionnaire into Arabic.” Pew Research Center. June 3. http://www.pewresearch.org/fact-tank/2016/06/03/the-challenges-of-translating-the-u-s-census-questionnaire-into-arabic/.
“CIA Values Language Capabilities Among Employees — Central Intelligence Agency.” 2010. Central Intelligence Agency. https://www.cia.gov/news-information/featured-story-archive/2010-featured-story-archive/cia-values-language-capabilities.html.
“Demographics.” 2017. Arab American Institute. Accessed April 28. http://www.aaiusa.org/demographics.
Dominus, Susan. 2010. “Interest Grows in Arabic Class at Friends Seminary.” The New York Times, June 11. http://www.nytimes.com/2010/06/12/nyregion/12bigcity.html.
Fan, Samantha P., Zoe Liberman, Boaz Keysar, and Katherine D. Kinzler. 2015. “The Exposure Advantage: Early Exposure to a Multilingual Environment Promotes Effective Communication.” Psychological Science 26 (7): 1090–97. doi:10.1177/0956797615574699.
Freedman, Samuel G. 2008. “Bridging Cultures, and Taking Arabic to Iowa.” The New York Times, January 2. http://www.nytimes.com/2008/01/02/education/02education.html.
Goldberg, David, Dennis Looney, and Natalia Lusin. 2015. “Enrollments in Languages Other Than English in United States Institutions of Higher Education, Fall 2013” Accessed April 28. https://apps.mla.org/pdf/2013_enrollment_survey.pdf.
Hallowell, Billy. 2012. “NYC Public School Mandates Arabic Language Studies for All 2nd Through 5th Graders.” TheBlaze. May 24. http://www.theblaze.com/news/2012/05/24/nyc-public-school-mandates-arabic-language-studies-for-all-2nd-through-5th-graders/.
Holtz, Jeff. 2006. “THE WEEK; Arabic Language Classes Are Added at High Schools.” The New York Times, August 6. https://query.nytimes.com/gst/fullpage.html.
Isensee, Laura. 2016. Arabic Immersion Magnet School Opens Doors Amid Protest. News 88.7 Education Desk. Houston. https://soundcloud.com/hpmnews887/arabic-immersion-magnet-school-opens-doors-amid-protests.
Lane, James. 2017. “The 10 Most Spoken Languages in the World.” The Babbel Magazine. Accessed April 28. https://www.babbel.com/en/magazine/the-10-most-spoken-languages-in-the-world.
Levin, Sara G. 2005. “Stuyvesant Muslim Students Now Able to Study Arabic.” The Villager. September. http://thevillager.com/villager_123/stuyvensantmuslimstudents.html.
“School Information / Our Mission.” 2017. Arabic Immersion Magnet School. Accessed April 29. http://www.houstonisd.org/Page/127139.
Sokolower, Jody. 2017. “Advocating for Arabic • An Interview with Lara Kiswani.” Rethinking Schools. http://www.rethinkingschools.org/archive/31_03/31-3_sokolower.shtml.
Wessler, Seth. 2009. “Silenced in the Classroom.” http://www.rethinkingschools.org/archive/23_03/sile233.shtml.
“World Languages: Ancient and Modern.” 2017. Friends Seminary. Accessed April 28. https://www.friendsseminary.org/page/curriculum-detail?fromId=209198&LevelNum=16&DepartmentId=6935.
Zorthian, Julia. 2013. “CT Students to Take Languages Courses on Campus.” Yale Daily News. September 26. http://yaledailynews.com/blog/2013/09/26/ct-students-to-take-language-courses-on-campus/.