
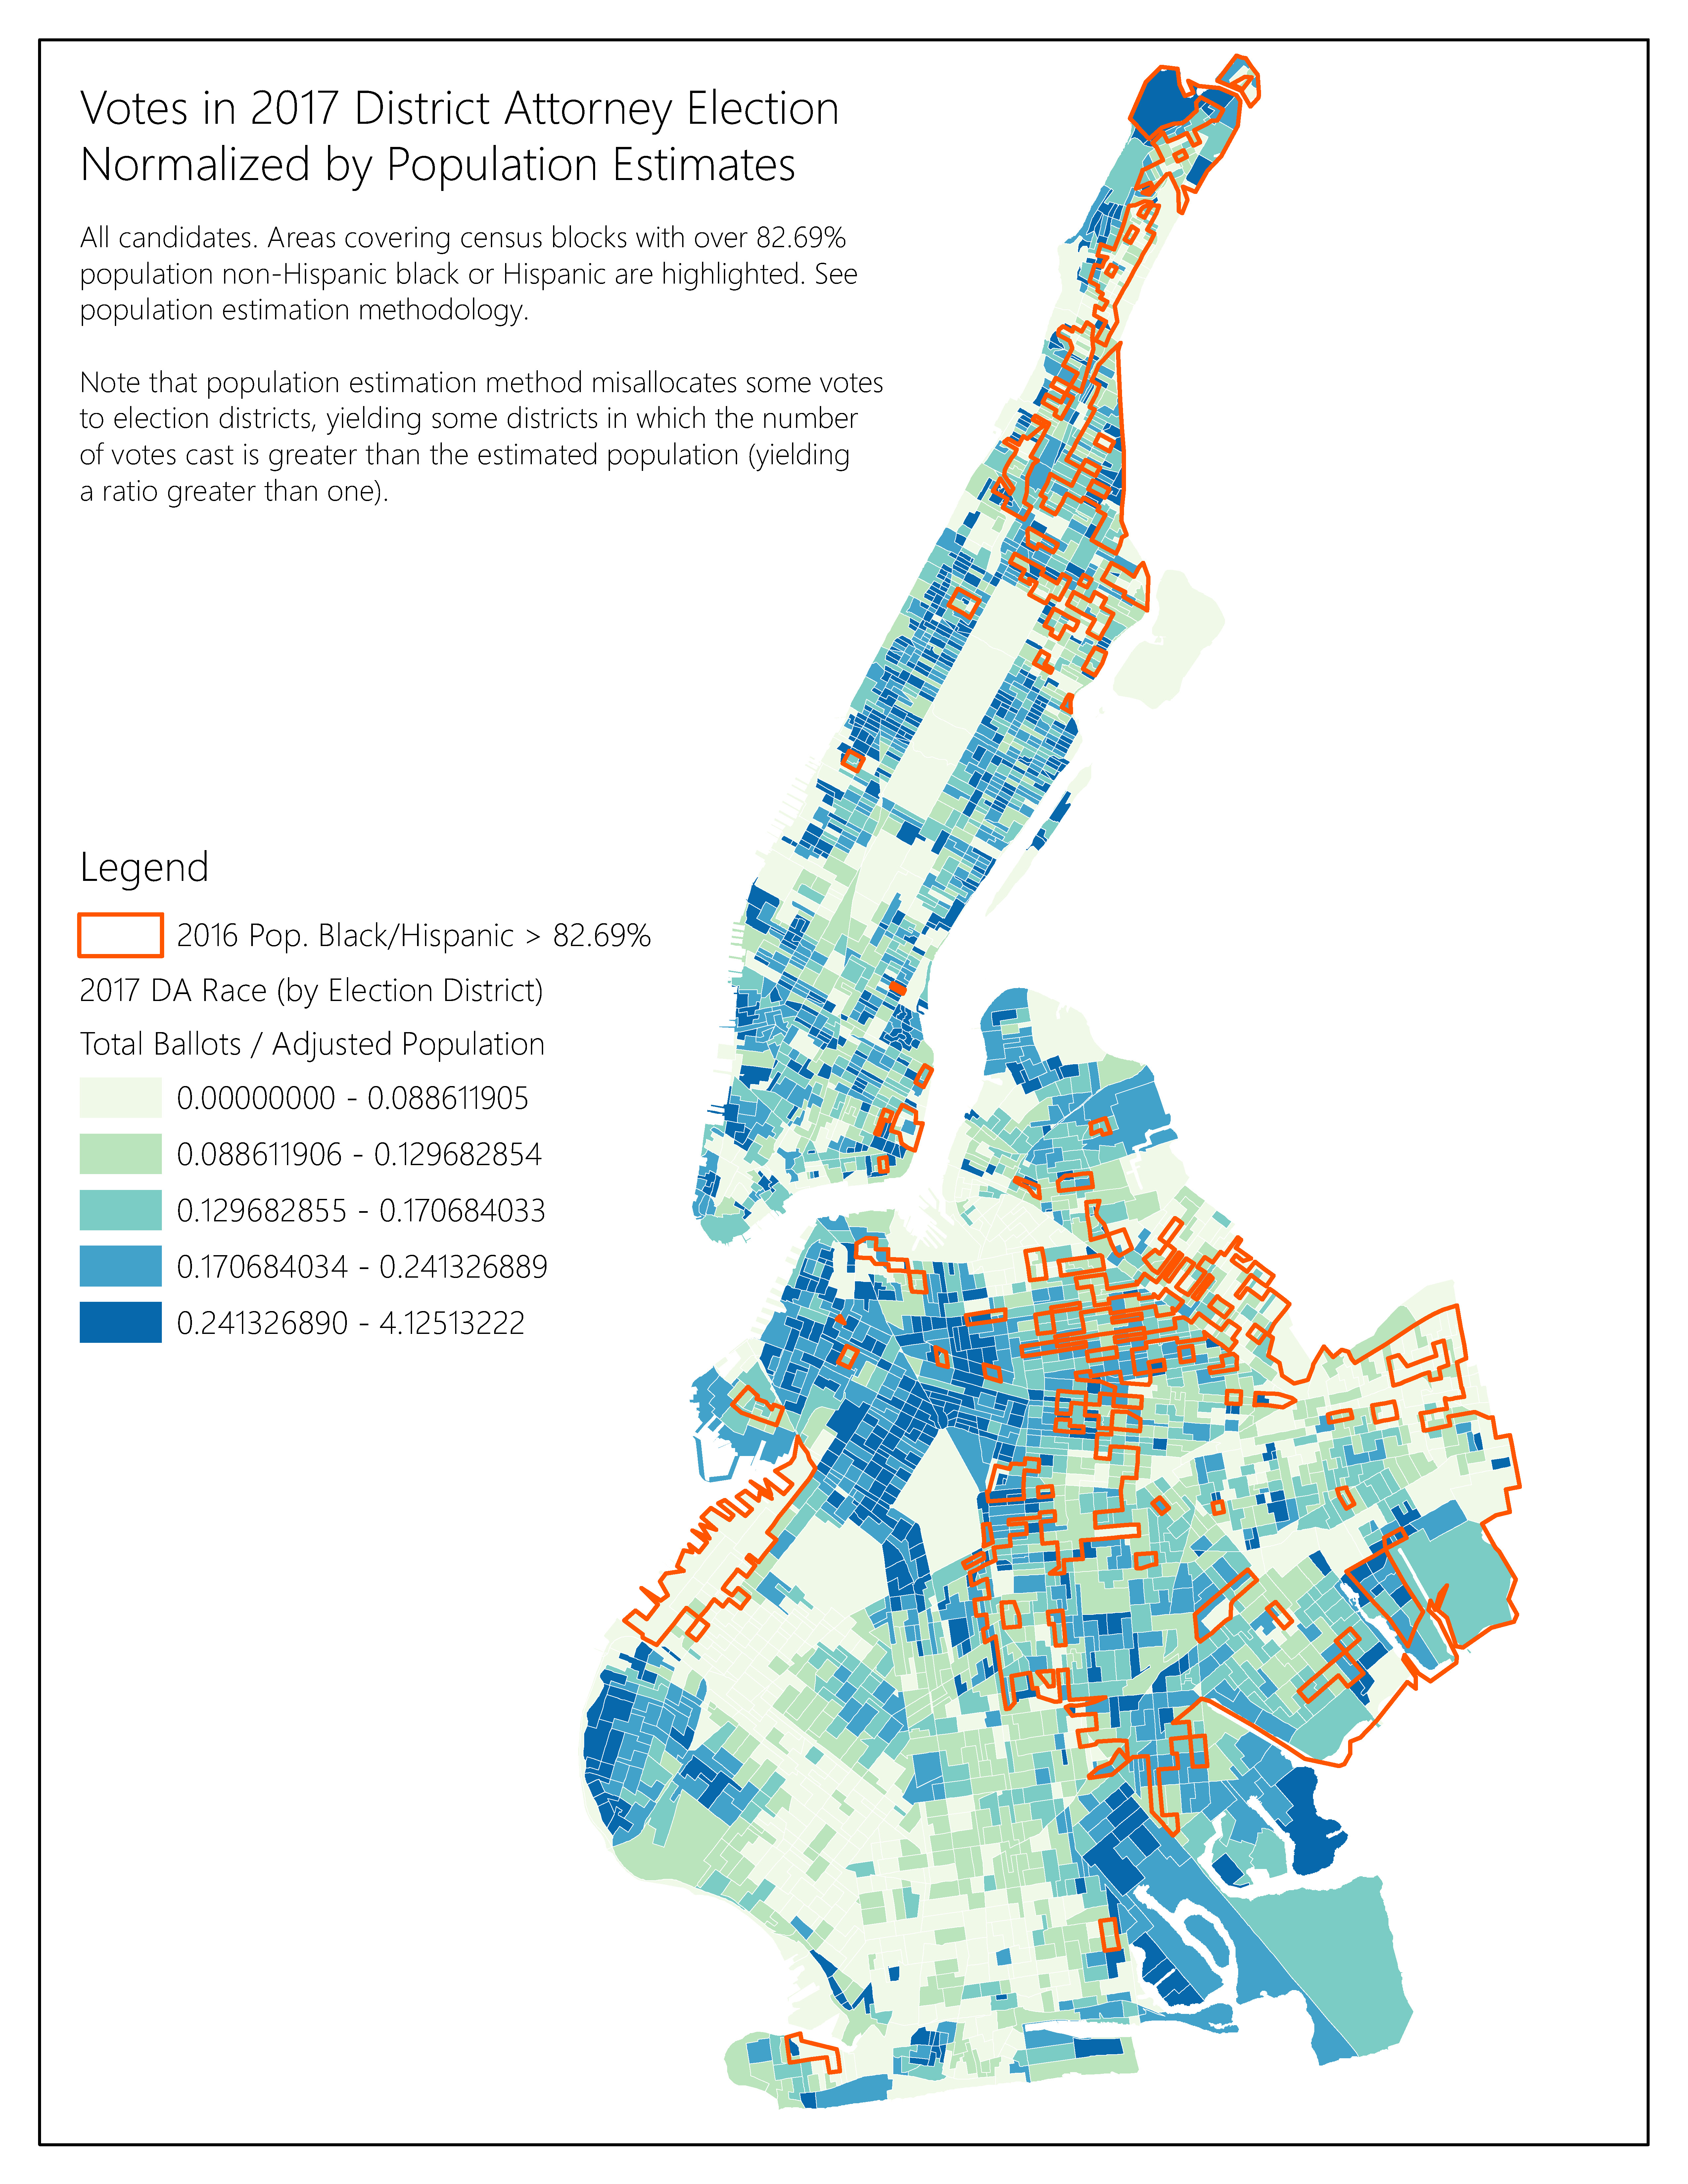
See below for maps showing all census tracts by percent black or Hispanic, and raw number of votes per election district. Note that election data are aggregated to the election district-level, while population data are aggregated into census tracts. See our methodology for details on how we assigned population counts to each election district.
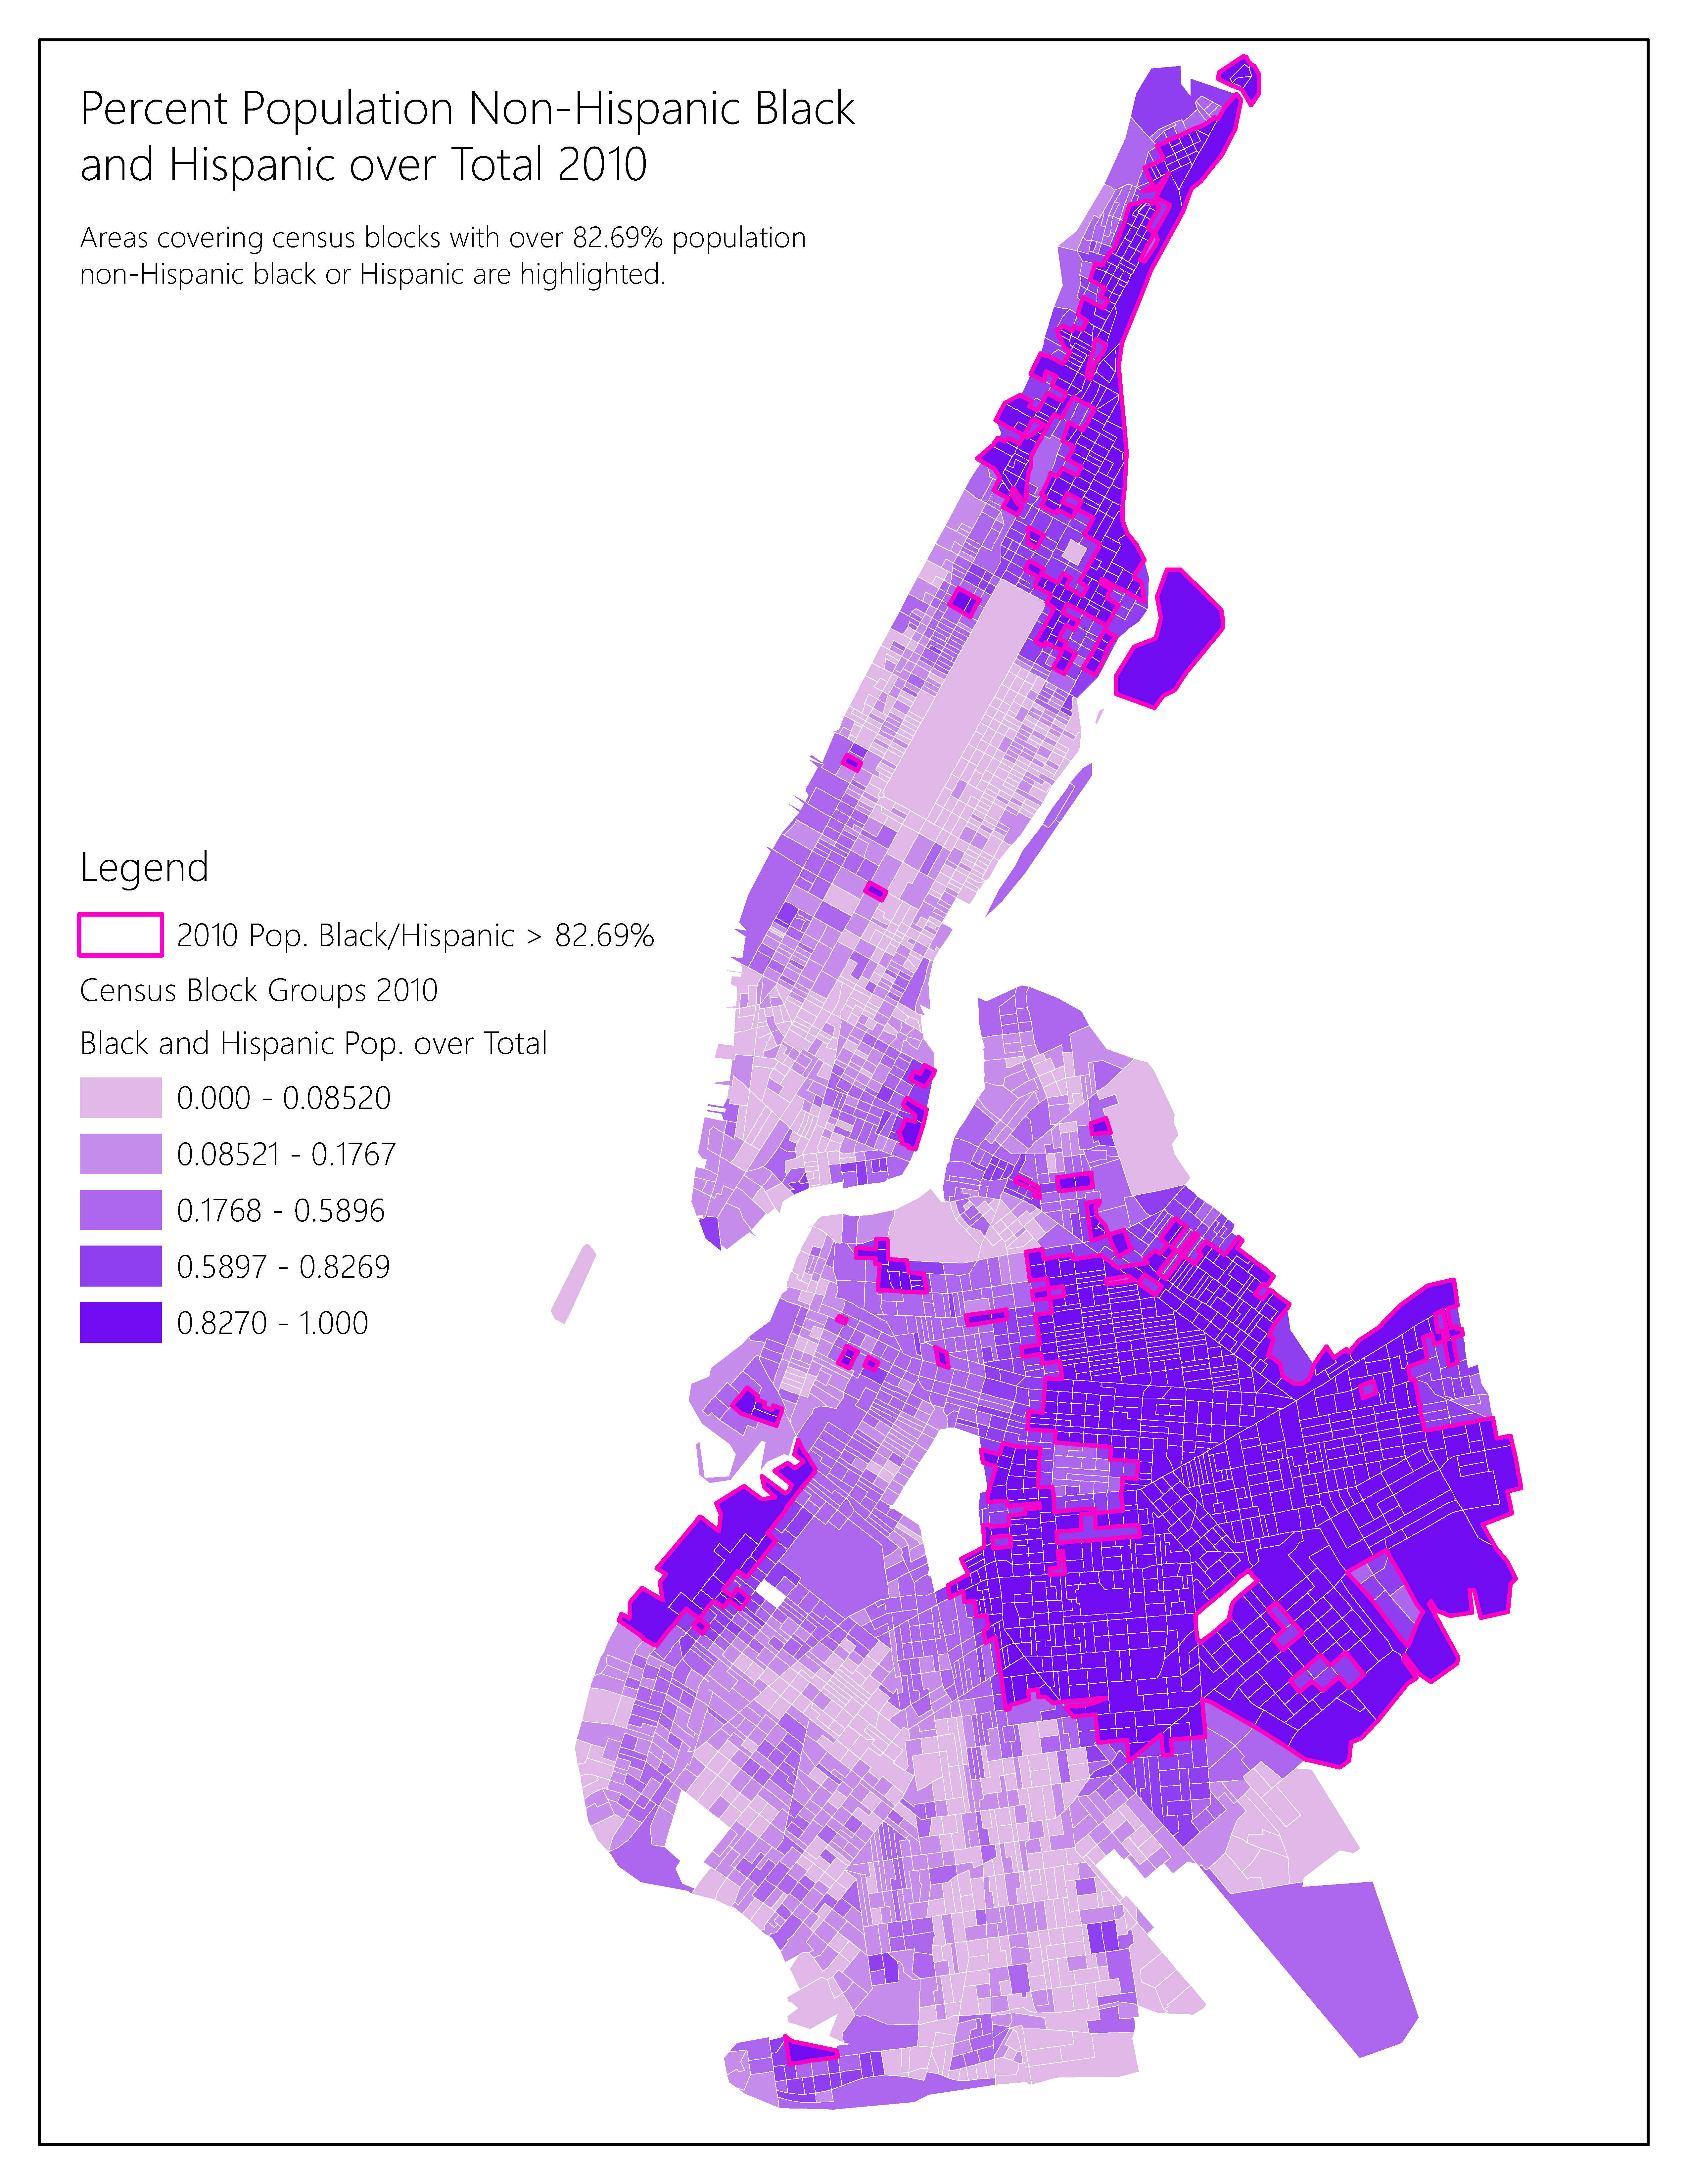

Race and ethnicity data are not available from each year. For each election, we used race and ethnicity data from the available year closest to the election.
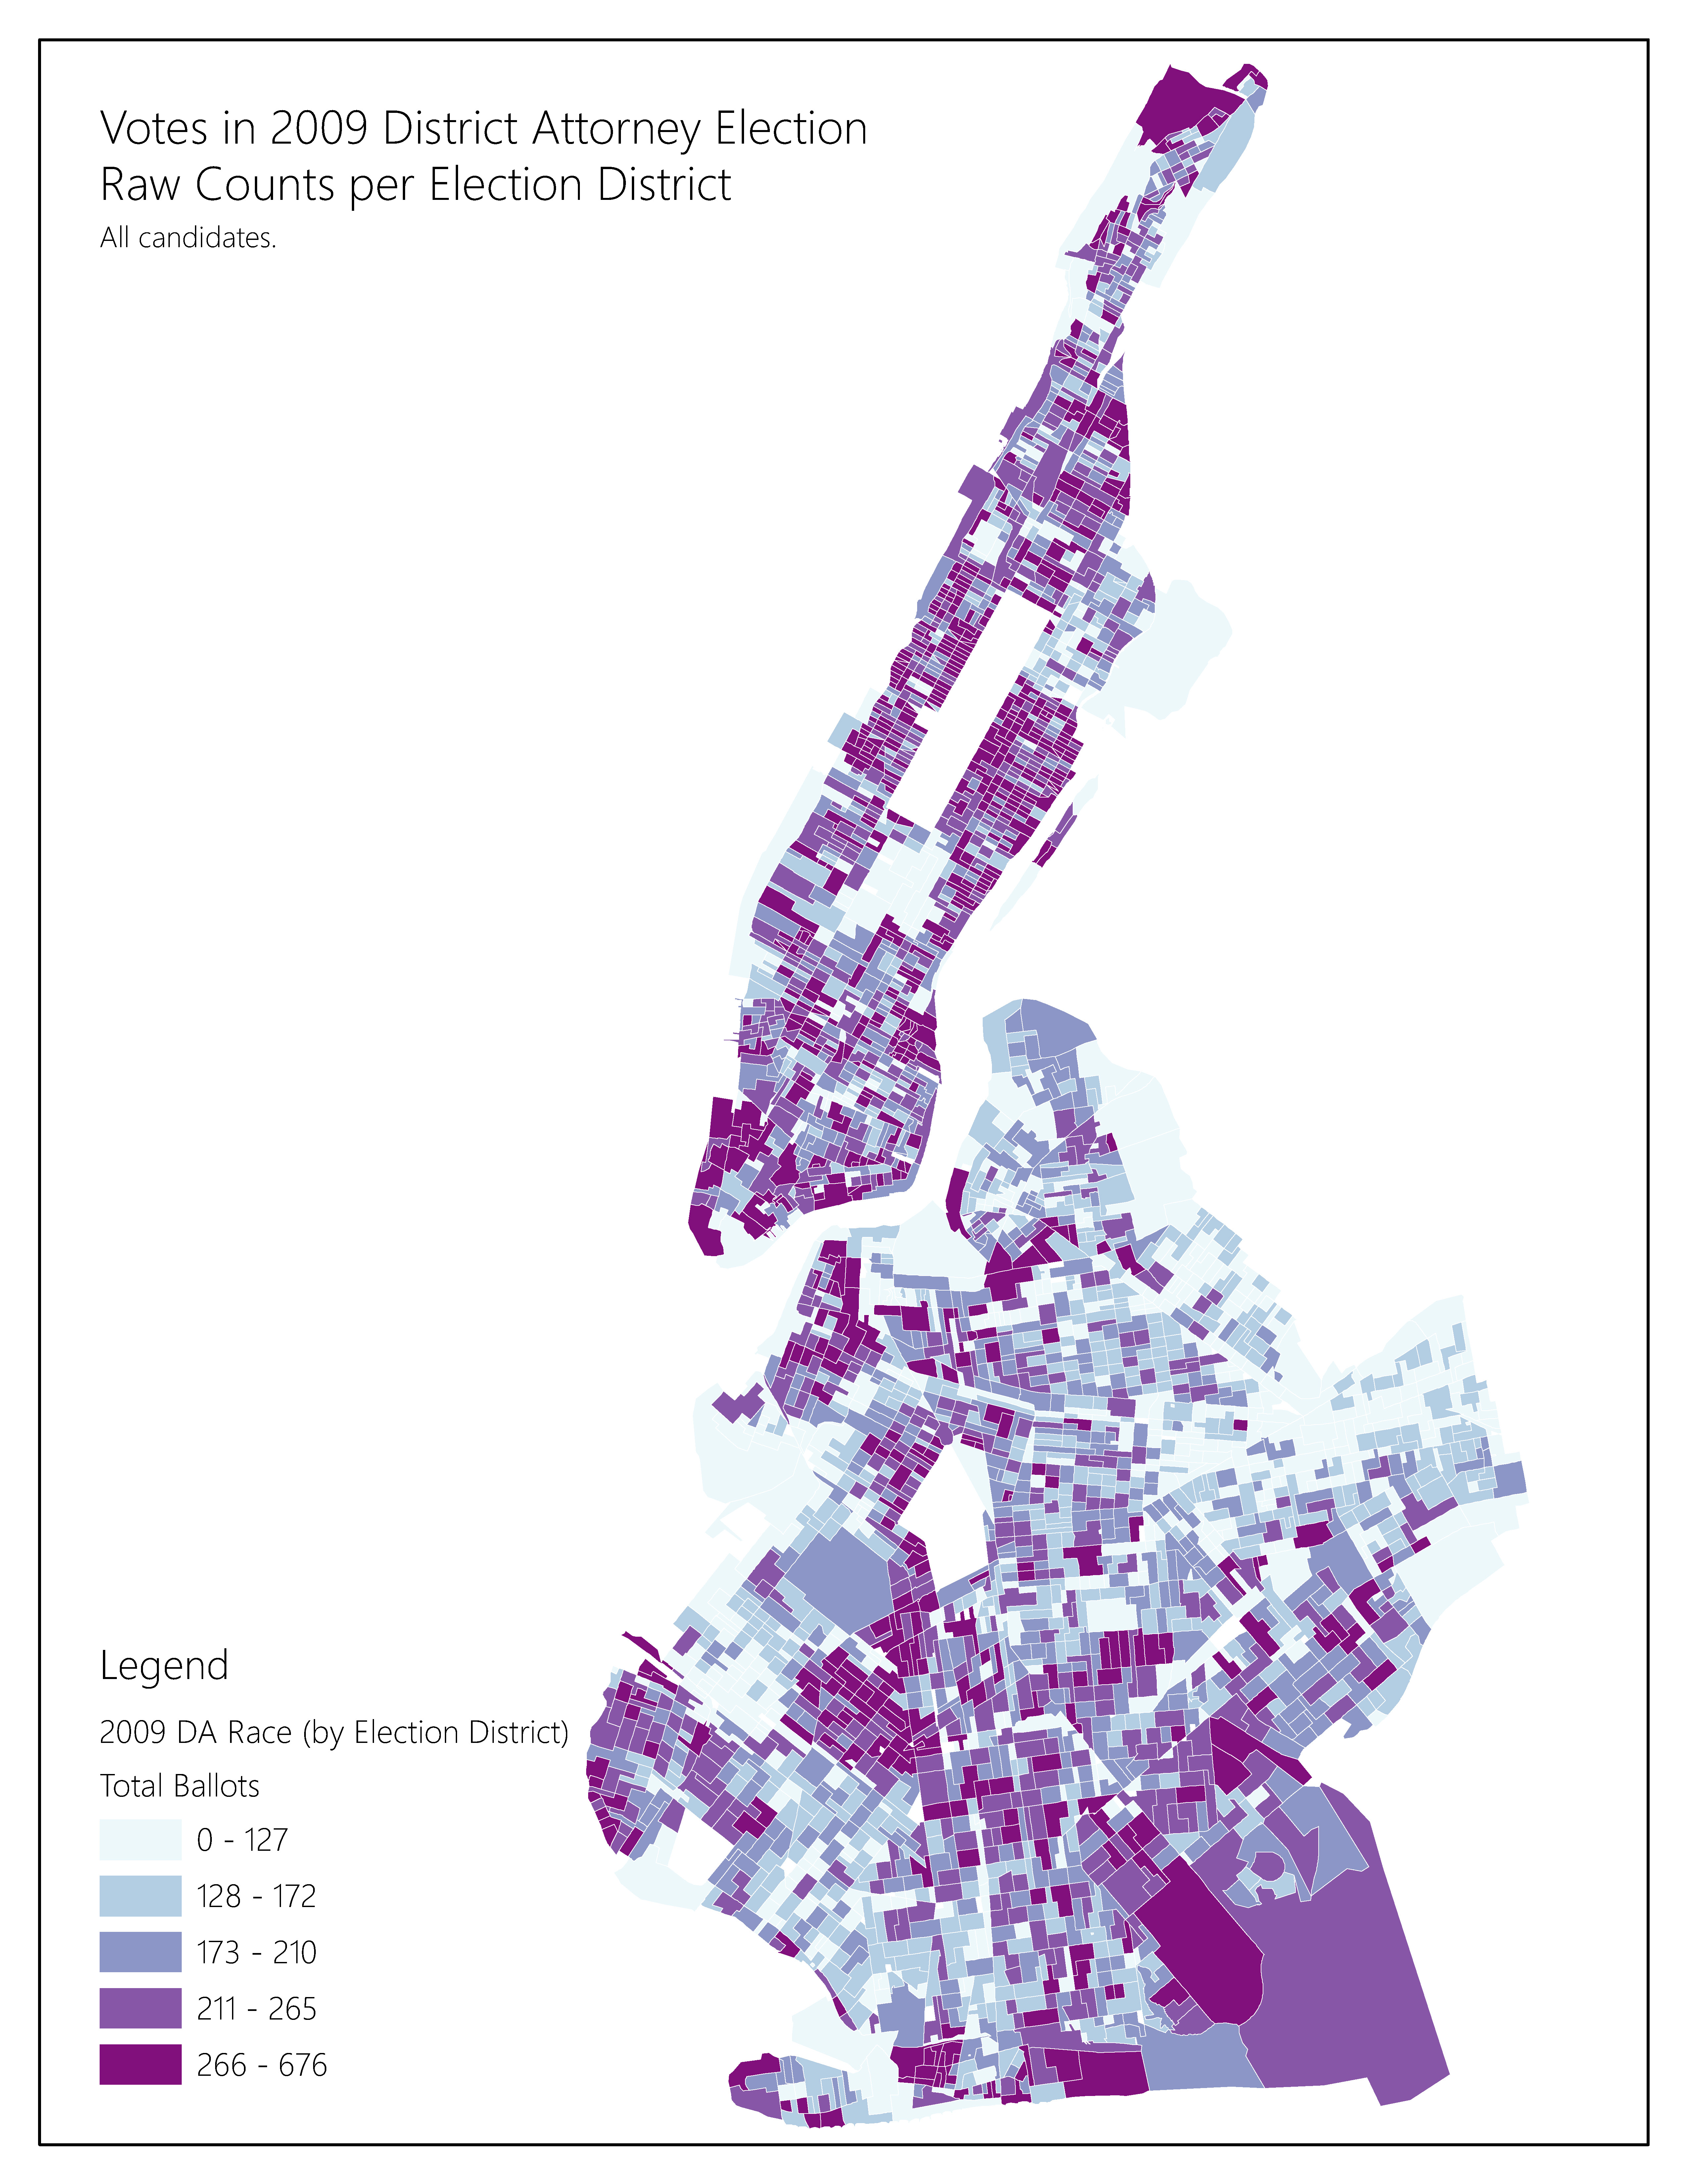

Maps by Sarah Levine, www.sarahmakesmaps.com